Download
1 / 53
540 likes | 725 Views
6. Chapter Six BA 315- LPC UMSL. Cost-Volume-Profit Analysis (Contribution Margin) CURL SURFBOARDS. The Break-Even Point. The break-even point is the point is the volume of activity where the organization’s revenues and expenses are equal.

E N D
6 Chapter Six BA 315- LPC UMSL Cost-Volume-Profit Analysis (Contribution Margin) CURL SURFBOARDS
The Break-Even Point The break-even point is the point is the volume of activity where the organization’s revenues and expenses are equal.
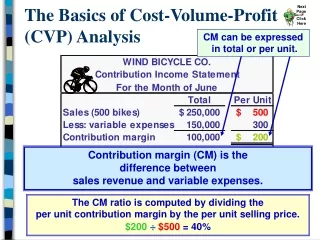
Contribution-Margin Approach Consider the following information developed by the accountant at Curl, Inc.:
Contribution-Margin Approach For each additional surf board sold, Curl generates $200 in contribution margin.
Contribution-Margin Approach We can calculate the break-even volume using the following equation. Fixed expenses Unit contribution margin Break-even point (in units) = Let’s calculate the break-even point in units for Curl, Inc.
$80,000 $200 = 400 surfboards Contribution-Margin Approach Let’s check our calculation.
Contribution-Margin Approach Break-even Point 400 × $500 = $200,000 400 × $300 = $120,000
Contribution margin Sales = CM Ratio Contribution-Margin Ratio We can calculate the break-even point in sales dollars rather than units by using the contribution-margin ratio.
Contribution margin Sales = CM Ratio Fixed expense CM Ratio Break-even point(in sales dollars) = Contribution-Margin Ratio We can calculate the break-even point in sales dollars rather than units by using the contribution-margin ratio.
$80,000 40% $200,000 sales = Contribution-Margin Ratio
Equation Approach Sales revenue – Variable expenses – Fixed expenses = Profit
Unit sales price Sales volume in units Unit variable expense Sales volume in units × × Equation Approach Sales revenue – Variable expenses – Fixed expenses = Profit At the break-even point profit equals zero, and the sales volume in units is unknown.
Equation Approach Sales revenue – Variable expenses – Fixed expenses = Profit ($500 × X) – ($300 × X) – $80,000 = $0 ($200X) – $80,000 = $0 X = 400 units At the break-even point profit equals zero, and the sales volume in units is unknown.
Graphing Cost-Volume-Profit Relationships Viewing CVP relationships in a graph gives managers a perspective that can be obtained in no other way. Consider the following information for Curl, Inc.:
Cost-Volume-Profit Graph Sales in Dollars Fixed expenses Units Sold
Cost-Volume-Profit Graph Total expenses Sales in Dollars Units Sold
Cost-Volume-Profit Graph Total sales Sales in Dollars Units Sold
Cost-Volume-Profit Graph Break-even point Sales in Dollars Units Sold
Cost-Volume-Profit Graph Profit area Sales in Dollars Loss area Units Sold
Profit 1 2 3 4 5 6 7 8 Units sold (00s) Profit-Volume Graph Some managers like the profit-volume graph because it focuses on profits and volume.
Profit 1 2 3 4 5 6 7 8 Units sold (00s) Profit-Volume Graph Break-even point
Profit 1 2 3 4 5 6 7 8 Units sold (00s) Profit-Volume Graph Sales revenue
Profit 1 2 3 4 5 6 7 8 Units sold (00s) Profit-Volume Graph Profit line
Profit 1 2 3 4 5 6 7 8 Units sold (00s) Profit-Volume Graph Profit area Loss area
Target Net Profit We can determine the number of surfboards that Curl must sell to earn a profit of $100,000 using the contribution- margin approach.
Contribution-Margin Approach We can determine the number of surfboards that Curl must sell to earn a profit of $100,000 using the contribution- margin approach. Fixed expenses + Target profit Unit contribution margin Units sold to earn the target profit =
Contribution-Margin Approach We can determine the number of surfboards that Curl must sell to earn a profit of $100,000 using the contribution- margin approach. Fixed expenses + Target profit Unit contribution margin Units sold to earn the target profit = $80,000 + $100,000 $200 = 900 surfboards
Equation Approach Sales revenue – Variable expenses – Fixed expenses = Profit ($500 × X) – ($300 × X) – $80,000 = $100,000 ($200X) = $180,00 X = 900 units
Applying CVP Analysis Safety Margin • The difference between budgeted sales revenue and break-even sales revenue. • The amount by which sales can drop before losses begin to be incurred.
Safety Margin Curl, Inc. has a break-even point of $200,000. If actual sales are $250,000, the safety margin is $50,000 or 100 surfboards.
Changes in Fixed Costs • Curl is currently selling 500 surfboards per month. • The owner believes that an increase of $10,000 in the monthly advertising budget, would increase bike sales to 540 units. • Should we authorize the requested increase in the advertising budget?
Changes in Fixed Costs 540 units × $500 per unit = $270,000
Changes in Fixed Costs $80,000 + $10,000 advertising = $90,000
Changes in Fixed Costs Sales will increase by $20,000, but net income willdecrease by $2,000.
Changes in Unit Contribution Margin Because of increases in cost of raw materials, Curl’s variable cost per unit has increased from $300 to $310 per surfboard. With no change in selling price per unit, what will be the new break-even point?
Changes in Unit Contribution Margin Because of increases in cost of raw materials, Curl’s variable cost per unit has increased from $300 to $310 per surfboard. With no change in selling price per unit, what will be the new break-even point? ($500 × X) – ($310 × X) – $80,000 = $0 X = 422 units (rounded up)
Predicting Profit Given Expected Volume { } Fixed expenses Unit contribution margin Target net profit Given: Find: {required sales volume} { } Fixed expenses Unit contribution margin Expected sales volume Given: Find: {expected profit}
Predicting Profit Given Expected Volume In the coming year, Curl’s owner expects to sell 525 surfboards. The unit contribution margin is expected to be $190, and fixed costs are expected to increase to $90,000.How much profit can we expect to earn?
Predicting Profit Given Expected Volume In the coming year, Curl’s owner expects to sell 525 surfboards. The unit contribution margin is expected to be $190, and fixed costs are expected to increase to $90,000. Total contribution - Fixed cost = Profit ($190 × 525) – $90,000 = X X = $99,750 – $90,000 X = $9,750 profit
CVP Analysis with Multiple Products For a company with more than one product, sales mix is the relative combination in which a company’s products are sold. Different products have different selling prices, cost structures, and contribution margins. Let’s assume Curl sells surfboards and sailboards and see how we deal with break-even analysis.
CVP Analysis with Multiple Products Curl provides us with the following information:
CVP Analysis with Multiple Products Weighted-average unit contribution margin $200 × 62.5%
CVP Analysis with Multiple Products Break-even point Break-even point Fixed expenses Weighted-average unit contribution margin = Break-even point $170,000 $331.25 = Break-even point 514 combined unit sales (rounded up) =
CVP Analysis with Multiple Products Break-even point Break-even point 514 combined unit sales =
Assumptions UnderlyingCVP Analysis • Selling price is constant throughout the entire relevant range. • Costs are linear over the relevant range. • In multiproduct companies, the sales mix is constant. • In manufacturing firms, inventories do not change (units produced = units sold).
Cost Structure and Operating Leverage • The cost structure of an organization is the relative proportion of its fixed and variable costs. • Operating leverage is . . . • the extent to which an organization uses fixed costs in its cost structure. • greatest in companies that have a high proportion of fixed costs in relation to variable costs.
Measuring Operating Leverage Operating leverage factor Contribution margin Net income =
$100,000 $20,000 = 5 Measuring Operating Leverage Operating leverage factor Contribution margin Net income =
Measuring Operating Leverage A measure of how a percentage change in sales will affect profits.If Curl increases its sales by 10%, what will be the percentage increase in net income?
Measuring Operating Leverage A measure of how a percentage change in sales will affect profits.