Download
1 / 27
270 likes | 387 Views
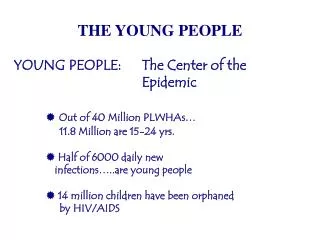
Young People in the Highlands and Islands Moray Community Planning Partnership. Date. The Issue – The “Missing 18500”. If the Highlands and Islands had the same age structure as Scotland, there would be 18500 (25%) more young people in the 15 to 30 age group. Figure for Moray is 2826 (19%).

E N D
Young People in the Highlands and IslandsMoray Community Planning Partnership Date
The Issue – The “Missing 18500” If the Highlands and Islands had the same age structure as Scotland, there would be 18500 (25%) more young people in the 15 to 30 age group. Figure for Moray is 2826 (19%)
Demographic Context – Regional and Local Youth Migration Study Brief and Methodology Key Findings – Regional and Local Target Groups The 4 “E”s In the words of our young people Policy Development Discussion Outline
Highlands and Islands (HIE area) 200 100 0 0 4 8 12 16 20 24 28 32 36 40 44 48 52 56 60 64 68 72 76 80 84 88 92 96 -100 average 2002- 2007 -200 -300 -400 -500 Source:General -600 Register Office for Scotland -700 Ref: P219/H&Ipro/ avemigcht -800 Net Migration by Age
Cumulative Net Migration by Age in theHighlands and Islands Sub Regions
1.15 Inner Moray Firth 1.10 Lochaber, Skye and Wester Ross Moray 1.05 Orkney 1.00 Shetland 0.95 Innse Gall Index 2001 = 1.00 0.90 Argyll and the Isles 0.85 Caithness and Sutherland Highlands and 0.80 Islands 0.75 Source:General Register Office for Scotland 0.70 Ref: Z\Data\Popn\ 0.65 DreamPeople\H&Ipro\ 2031 2029 2007 2009 2011 2013 2015 2017 2019 2021 2023 2025 2027 subreg1530cht 15-30 Year Old Population Trends
Young Person Population Gap: Increase in 15-30 Population needed to Fill Youth Population Gap 632 (16%) 873 (27%) 2061 (36%) 1963 (33%) 1371 (34%) 2826 (19%) 4703 (19%) 4118 (40%)
Objectives • Explore attitudes to living, studying and working in the Highlands and Islands • Establish factors that influence migration • Identify appropriate initiatives • Establish baseline
Responses H&I Responses 1500 school pupils, 1600 young adults, 300 young adults living in other parts of the UK Gender Female 60% Male 40% Moray 218 in total 203 schools response
Drivers Economic Growth Current Reality Future Trends Young People in the Highlands & Islands Labour Market Conditions Sustainable Communities New Industries
2768 respondents A good place to bring up a family A place where I feel safe A place I am proud to be associated with A place where I want to live for the rest of my life A place where everyone knows my business There are few jobs which pay well Few opportunities to access university and college courses A good place to live as a teenager A boring place in which to live A place where it's OK to be different A place which values its young people A place only suited to retired people Plenty of job opportunities 0% 10% 20% 30% 40% 50% 60% 70% 80% 90% 100% Z:\PROJECTS\P219 HIE youth migration\ SNAPanalysis2\CommunityTotal.xls Strongly agree Slightly agree Neither agree nor disagree Slightly disagree Strongly disagree Don't know Community Total Summary Perceptions
Positive Perceptions • Few opportunities to access to university and college courses (43% v 48%) • A place where everyone knows my business (42% v 56%) • A place where it is OK to be different (38% v 35%) Remember the majority of respondents are 18 and under and this is reflected in their views compared to all respondents in the survey
Less Positive Perceptions • Proud to be associated with the area (61% v 72%) • A good place to bring up a family (73% v 82%) • A place that values its young people (26% v 31%) • A place that I feel safe (66% v 80%) • A boring place to live (44% v 40%) • A good place to live as a teenager (44% v 50%)
Orkney Shetland A good place to live as a young Better job prospects person or with a family, with Stronger affinity to the area value placed on young people More suited to retired people Stronger affinity to the area and less suited to young people Better job prospects, but few which pay well Innse Gall Caithness and Poor economic opportunities Sutherland Much stronger affinity to the Inner Moray Firth area Fewer job opportunities More suited to young people Lower level of tolerance of A good place to grow up in differences Less safe Value their young people Better paying jobs and teenager and family friendly Highlands Moray and Islands Weaker affinity with the area Lochaber, Skye and Better access to educational Wester Ross opportunities Less suited to the needs of Less value placed on young young people, but a good place people and less family and Argyll and Bute to live later in life teenager friendly Very safe and relatively tolerant Fewer job opportunities Lower levels of tolerance More suited to retired people P219/snap analysis 2/areas/comparison and less suited to young people areas/LEC area comparisons/pp comparison slide Perceptions – Variations across Region
Predicted Living Location at Key Life Stages Very similar to Inverness, Lochaber and Easter Ross
Perceptions by age: training and employment opportunities in the Highlands and Islands
Perceptions by Age: Young People’s Experiences of Life in the H&I
Perceptions by Age: Appeal of Highlands and Islands to Specific Age Groups
Push and Pull Factors Push Factors Age 17-20 – Access to Higher Education After Higher Education – top 4 push factors or barriers to returning • Lack of employment in relevant industries • Lack of well paid jobs • Lack of jobs with career progression • Opportunity to experience life in a new place Pull factors that would make a difference to returning • Broader range of jobs • More jobs with career prospects • More higher paid jobs • Easier access to affordable and mid cost housing • More recreational/social opportunities
“TOP 10 FACTORS” • Broader range of jobs • More jobs with better career prospects self employment opportunities, including self employment • More higher paid jobs available • Wider Higher Education curriculum available within H&I and development of associated facilities • New emerging employment opportunities in relevant industries • Easier access to affordable housing • More recreation/social opportunities • Cheaper transport links • Faster transport links • Greater electronic connectivity Economic Natural environment Affinity Connections
Engagement • Education • Employment • Environment Policy Responses
Effective Intervention • All agencies recognise importance of demographic imbalance • Alignment of public, private and third sectors • Further liaison with young people to identify messages and effective communication channels
Levels of Intervention National Regional Local