Download
1 / 26
260 likes | 291 Views
Explore the innovative shielding design for ETOILE Hadron Therapy Center featuring a superconducting cyclotron, energy modulation systems, neutron angular distributions, primary ion beams interaction with materials, and more. Discover the critical source parameters, transmission efficiency of the Energy Selection System, and the modeling with MCNPX. The shielding design is based on French regulations for public and controlled areas.

E N D
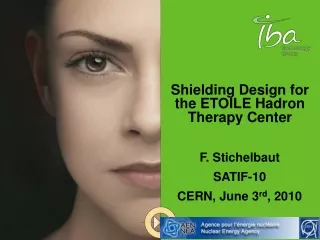
Shielding Design for the ETOILE Hadron Therapy Center F. Stichelbaut SATIF-10 CERN, June 3rd, 2010
Introduction • IBA Company is the industry leader in proton therapy technology with 16 PTcenters installed or in construction in the world. • IBA has submitted an offer to the Groupement de Coopération Sanitaire (GCS) to build the ETOILE hadron therapy system in Lyon (France). • This center will be build around a superconducting cyclotron able to accelerate: • 12C6+, 10B5+ ,6Li3+ and 4He2+ ion beams to 400 MeV/u • Proton beams to 260 MeV • The ions will be extracted by electrostatic deflector. • An Energy Selection System (ESS) is used to modulate in energy the beam extracted from the cyclotron. • ETOILE center will be equipped with 4 treatment rooms: 2 gantry rooms and 2 fixed beam rooms.
IBA C400 Cyclotron External diameter = 6.6 m Height = 3.4 m Weight = 700 Tons
ETOILE Layout Carbon Gantry Room Fixed Beam Room (0°, 45°) Proton Gantry Room 50 m R&D Room Cyclotron + ESS room 80 m
Radiation Source Determination • Primary ion beams can interact with different materials during their travel: • Graphite degrader (C) • Beam transport elements (Cu, Fe) • Patient or water phantom • Secondary particle production has been computed using PHITS code for 1H, 4He, 6Li, 10B and 12C ions impinging on: • thick Cu and H2O targets; • C targets with variable thicknesses. • PHITS results have been benchmarked on HIMAC data for 12C and 4He ions stopping in C and Cu.
Neutron Angular Distributions • 12C: The neutron yield evolution with polar angle Q is very well reproduced by PHITS at all energies, except for Q = 0° 4He: Good agreement for Q > 30°.
Neutron Thick Target Yields H2O Target Cu Target
Secondary Charged Particles • Besides secondary neutrons and photons, charged particles will also be produced: protons, deuteron, alpha, … • These heavy particles are strongly forward-peaked.
Secondary Particles from Degrader (1) • Ion beams are extracted from the C400 cyclotron with fixed beam energy (400 MeV/u) • Energy modulation is performed thanks to a graphite wheel with variable thickness. • As the degrader is a thin target, some charged ions can leave the degrader and follow the beam line.
Secondary Particles from Degrader (2) Yield of parasitic ions transmitted by ESS per transmitted ion Ions with same Q/M DE/E < 0.6% Q < 12 mrad Yield (4He) < 3.10-4
Demonstrating Critical Source Parameters Beam Concrete Tallies • To determine the parameters of the attenuation laws for secondary particles, we use a simple MCNPX model. • Shell filled with standard concrete (r = 2.3 g/cm3) with an inner radius of 1 m and an outer radius of 4 m. • The neutron source is put at the origin, the primary beam being aligned along X axis. • Determination of evolution of neutron/photon doses as a function of concrete depth and emission angle Q from 0°to 180°. • Study influence of: • Ion species • Beam energy • Target type • Emission angle Q 1 m 4 m Y X
Neutron Tenth-Value Thickness • Attenuation curves fitted in two parts TVT0 (r < 90 cm) and TVTe (r > 90 cm). • Small dependance of TVTe values on the target type • For ions with energy values leading to same range in water, TVTe values increase with ion mass.
Energy Selection System (ESS) Transmission Efficiency (1) Accelerator Quadrupoles Energy Slits Graphite Degrader + Tantalum Collimator Bending magnets
ESS Transmission Efficiency (2) • The angular acceptance of the transport beam line is limited to Q < 12 mrad. • The energy acceptance of the transport beam line is limited to DE/E < 0.6%. eglobal = e(transmission) x e(Q < 12 mrad) x e(DE/E < 0.6%)
ESS Transmission Efficiency (3) Transmission efficiency obtained with PHITS Comparison between various ions
ETOILE Modelling with MCNPX 2.5.0 isocenters GTRC FBR GTRp Cyclotron R&D
RadioProtection Assumptions • Shielding design based on French regulation: • Public area: ET < 80 µSv/month • Monitored area: ET < 7.5 µSv/hour • Controlled area: ET < 25 µSv/hour • For the monitored and controlled areas, the worst hour must be considered. • Detailed RP assumptions published by GCS to compute the hourly and monthly dose rates inside and outside ETOILE center using 1H, 4He and 12C beams. • Here, present two cases of hourly dose rates obtained for a continuous irradiation of water phantom with monoenergetic beams, assuming a delivered dose of 2 Gy/min in 1 liter target.
Results: Cyclotron Room Hourly dose rate in cyclotron room for 2 Gy/min in 1 liter target at isocenter. In front of degrader
Results: Carbon Gantry Room (1) Hourly dose rate in GTRC for a dose deposition of 2 Gy/min in water phantom beam
Results: Carbon Gantry Room (2) Hourly dose rate in GTRC for a dose deposition of 2 Gy/min in water phantom 30 minutes operation (QA) H*(10) < 7.5 µSv/h
Modeling of GSI Experiment • Modeling of GSI Cave A using PHITS + MCNPX. • Use published concrete composition and density [1]. • Scoring regions simulated by void spheres of 20 cm diameter located 75 cm below the beam level. • Ambient dose equivalent H*(10) computed using fluence-to-dose coefficients for neutrons, protons and photons from ICRP-74 and Pellicioni. • Separate runs performed for each of the radiation sources computed by PHITS Scoring regions: OC-9 to OC-14 (n, g, 1H, 2H, 4He). [1] S. Rollet et al, Radiat. Meas. 44 (2009) p.649-659.
Results: Ambient Dose Equivalents (1) • Comparison of the ambient dose equivalents obtained at the various OC locations with: • PHITS: this analysis using PHITS and MCNPX. • FLUKA: average of results obtained with FLUKA and MCNPX codes [1]. • Data: measurements obtained using Bonner spheres [1]. • Good agreement between data and MC.
Results: Ambient Dose Equivalents (2) • For the neutrons, relative contribution • of different energy ranges to the total • ambient dose equivalent. • Neutrons > 20 MeV contribute more than 50% to the ambient dose.