Download
1 / 15
150 likes | 241 Views
Use simulation model to determine bidding strategy for maximizing profit on a construction project bid. Consider competitor bids and project costs to make informed decisions.

E N D
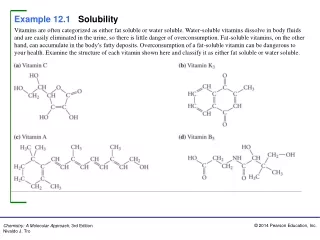
Example 12.1 Operations Models: Bidding on Contract
Background Information • The Miller Construction Company is trying to decide whether to make a bid on a construction project. • Miller believes it will cost the company $10,000 to complete the project, and it will cost $350 to prepare a bid. • Four potential competitors are going to bid against Miller. The lowest bid will win the contract. • Based on past history, Miller believes that each competitor’s bid will be a multiple of our cost to complete the project, where this multiple has a triangular distribution with minimum, most likely, and maximum values 0.9, 1.3, and 2.5.
Background Information -- continued • These four competitor’s bids are also assumed to be independent of one another. • If Miller decides to prepare a bid, then it has decided that its bid amount will be a multiple of $500 in the range $10,500 to $15,000. • The company wants to use simulation to determine which strategy to use to maximize its expected profit.
Solution • The logic is straightforward. • We first simulate the competitor’s bids. Then for any bid Miller makes, we see whether Miller wins the contract, and if so, what its profit is.
BIDDING.XLS • The spreadsheet model appears on the next slide. • This file contains the model.
Developing the Simulation Model • The model can be developed with the following steps. • Inputs. Enter the inputs in the shaded cells. These include Miller’s costs, Miller’s possible bids, and the parameters of the triangular distribution for the competing bids. • Miller’s bid. We can test all of Miller’s possible bids simultaneously with the RISKSIMTABLE function. Do this in cell B15 with the formula =RISKTABLE(PossibleBids). • Competitor’s bids. Generate random bids for the four competitors in the CompBid range by entering the formula =RISKTRIANG($B$9,$B$10,$B$11)*ProjectCost in cell B19 and copying across. Of course Miller will not see these other bids until it has submitted its own bid.
Developing the Simulation Model -- continued • Win contract?. See whether Miller wins the bid by entering the formula RISKOUTPUT( )+IF(MillerBid<MIN(CompBids),1,0)in cell B23. Here, 1 means that Miller wins the bid, and 0 means a competitor wins the bid. Note that we are designating this cell as an output cell for @RISK. • Miller’s profit. If Miller submits a bid, the bid cost is lost for sure. Beyond that, the profit to Miller is the bid amount minus the cost of completing the project if the bid is won. Otherwise, Miller makes nothing. So enter the formula=RISKOUTPUT( ) +IF(B23=1,MillerBid-ProjectCost,0)-BidCost in cell C23. We also designate this as an output cell.
Using @RISK • We set the number of iterations to 1000 and the number of simulations to 10. • The summary results appear on the next slide. • For each simulation – that is, each bid amount – there are two outputs: 1 or 0 to indicate whether Miller wins the contract and Miller’s profit. • A little thought should convince you that each of these can have only two possible values for any bid amount (win: Bid-10000-350;Lose: -350)
Using @RISK -- continued • For example, if Miller bids $12,000, it will either win or lose the contract, and its profit will be either $1650 or -$350. • This is reflected in the histogram of profit for this bid amount shown on the next slide, where there are only two bars. • The two possible values of the outputs appear in the Minimum and Maximum columns of the table on the previous slide.
Using @RISK -- continued • The Mean column, on the other hand, indicates the average of these values over the 1000 iterations. • For example, the mean of 0.545 for the “Win Bid?” output for simulation #4 indicates that Miller wins the contract on 54.5% of the iterations when bidding $12,000. • The mean profit of $740 for this bid amount is simply a weighted average of the two possible profits, $1650 and -$350.
Using @RISK -- continued • Specifically, you can check that it is 0.545(1650)+0.455(-350) = 740. The other means in the output can be interpreted similarly. • What should Miller bid? • First, it is clear that Miller should bid. Not bidding means no profit, Whereas all of the possible bids except for the last one lead to a positive expected profit with at most a $350 loss.
Using @RISK -- continued • If Miller is an EMV maximizer, as we discussed in Chapter 10, then the $12,000 bid should be chosen because it has the highest mean profit. • However, if Miller is risk averse, a smaller bid amount might be attractive. • As the bid amounts increase, the upside potential is greater, but the chance of not winning the bid and losing $350 increases.