Download
1 / 12
120 likes | 145 Views
Climate change in the D-region. Mark A. Clilverd 1 , Roger Duthie 1 , Craig J. Rodger 2 , Rachael L. Hardman 1,4 , and Keith H. Yearby 3 1 British Antarctic Survey (NERC), Cambridge, UK. 2 Department of Physics, University of Otago, Dunedin, New Zealand.

E N D
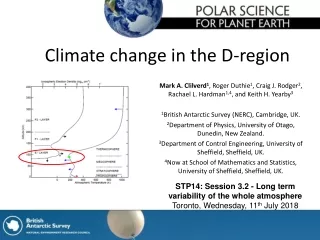
Climate change in the D-region Mark A. Clilverd1, Roger Duthie1, Craig J. Rodger2, Rachael L. Hardman1,4, and Keith H. Yearby3 1British Antarctic Survey (NERC), Cambridge, UK. 2Department of Physics, University of Otago, Dunedin, New Zealand. 3Department of Control Engineering, University of Sheffield, Sheffield, UK. 4Now at School of Mathematics and Statistics, University of Sheffield, Sheffield, UK. STP14: Session 3.2 - Long term variability of the whole atmosphere Toronto, Wednesday, 11th July 2018
The expected effect of greenhouse gas increases. Laštovička et al., Ann. Geophys. 2008. Trends in the [lower] ionosphere below 100 km, derived from LF radio propagation data, have been studied primarily in Europe. Trends in the lowermost part of the ionosphere could be investigated with the use of the VLF radio wave propagation measurements over long distances. As far as we know, such an analysis has not yet been made. A very important point to be discussed in relation to long-term trend studies is the various uncertainties in data and also the long-term non-stability of measurements.
What experiment stays the same for 40+ years? The NAA VLF transmitter 1MW output, since 1961 (~20 MW input). 24.0 kHz since 1983. 17.8 kHz before that.
Making measurements of VLF radio waves: Radio transmissions at Very Low Frequencies (VLF) largely trapped between the conducting ground (or sea) and the lower part of the ionosphere (70-90 km) , forming the Earth-ionosphere waveguide. Changes in the ionosphere cause changes in the received signal. The nighttime D-region is primarily generated by the ionisation of NO by solar Lyman-α (121.6 nm) scattered by the neutral hydrogen in the Earth’s geo-corona.
DEMETER view of NWC at 19.8 kHz From: J.-A. Sauvaud et al., Geophys. Res. Lett., 35, L09101, doi:10.1029/2008GL033194, 2008. ‘provides a nice example of diffraction pattern’
NAA at Halley: detecting the minima Night Sunrise modal minima Day 1971-1975: Paper charts on a multi-channel receiver NAA trace Time (UT)
Previous work on sunrise modal minima times (Clilverd et al., Radio Sci., 34(4), 939-948, 1999) LWPC amplitude versus distance Variation of NAA modal minima over a year Measured just under the ionosphere Sunrise at a receiver at 75km altitude. Measured near ground level
Changing Frequency [NAA was 17.8 kHz in 1971, but changed to 24.0 kHz in 1983 staying the same since.] Changing frequency changes the locations of the nighttime modal minima. But we can model the change. NAA, 24.0 kHz NAA, 17.8 kHz
The timing of sunrise at the Tx in Nov/Dec, and fringe distance from Tx 10:43:40 UT on 28 November. Equivalent to the terminator crossing overhead of the transmitter at an altitude of 71.5km +/- 2km (i.e., +/- 30 s) LWPC was used to investigate the sensitivity of the NAA nighttime fringe distance to Wait’s electron density profile parameters: h′ and β. It was found that the NAA fringe distance was relatively insensitive to β, but a contraction of 10% could be achieved through a reduction in nighttime h′ by 3 km. Both sunspot activity samples show gradients of ~5 km/year, i.e., 10% change in fringe distance in 45 years.
Summary • Using a VLF transmitter in the same location, same power, we have investigated where modal minima occur on the great circle path to Halley over 40+ years. • The transmitter fringe pattern at 70-80 km altitude (lower D-region) appears to be contracting at a rate of 4-6 km/year. • The 10% fringe pattern contraction is consistent with a height change in the nighttime D-region of ~3 km (downwards). At a fixed altitude electron density would increase. This is consistent with the predicted effects of greenhouse cooling /contraction of the mesosphere. Reference: Clilverd, M. A., R. Duthie, C. J. Rodger, R. L. Hardman, and K. Yearby, Long-term climate change in the D-region, Nature: Scientific Reports, 7:16683, doi:10.1038/s41598-017-16891-4, 2017.
Uncertainties • 2012: We use 10 s averages, timing <1 second • 1971: 0.5 mm or ~30 seconds, time accurate to within 30 secs. • Path length 13,000 km – 4 hours for terminator to sweep along path – ~50 km/min • Movement of modal feature is ~70 km/1 km in H prime. • Timing uncertainties are therefore about 25km, which is ~0.3 km in H prime. Halley Nov 2015 modal min times are unstructured, and need further investigation.