How Digital Analytics Drives the Customer Experience
420 likes | 646 Views
How Digital Analytics Drives the Customer Experience. Agenda . Identifying the Business Users (Who Are You ?) Who am I? Customer Experience Marketing The Bridge: The Importance of Digital Analytics Digital Analytics Tools Case Studies/Examples Takeaways Question/Comments.

How Digital Analytics Drives the Customer Experience
E N D
Presentation Transcript
How Digital Analytics Drives • the Customer Experience
Agenda • Identifying the Business Users (Who Are You?) • Who am I? • Customer Experience Marketing • The Bridge: The Importance of Digital Analytics • Digital Analytics Tools • Case Studies/Examples • Takeaways • Question/Comments
Who are you? • What are you and/or your company doing in digital? • How involved are you in digital analytics? • What tools are you using? • What do you want to take away from today’s presentation?
Who am I? • Marketing views • Experience • Education • At play Kelsey Horine, Senior Web Analytics Consultant
CEM – What and Why? • is a customer-centric, data-driven strategy of communicating with the customer. It’s an approach to deliver relevant interactions that anticipate and respond • to the many ways consumers want to engage, shop and buy today experience : when fueled byrelevance • drawn from customer intelligence yields dramatic results
What is Digital Analytics? AvinashKaushik defines Web Analytics as: • The exploration of qualitative and quantitative data • To drive a continual improvement of the online experience of your customers and prospects • Which translates into your desired outcomes (online & offline). Digital: Web, social media, email, online advertising, mobile, video, and search. Sources: AvinashKaushik, http://www.kaushik.net/avinash/web-analytics-101-definitions-goals-metrics-kpis-dimensions-targets/, 2010 Jessica Straka, http://threeminds.organic.com/2011/01/digital-analytics-in-a-nutshell.html, 2011
70% of visitors leave at this first page, possibly due to no clear “order now link” Optimizing the Mobile Site Experience: Sample Customer Experience Desired Outcome: Increase consumer sales Goal: Increase sales from mobile KPI: Mobile sales 72% of Consumers Expect Brands to Have Mobile-Friendly Sites - ADWEEK Through digital analytics I can focus just on mobile browsers and look at fallout.
70% of visitors leave at this fist page, possibly due to no clear order now link • For the 30% of visitors who remain 20% click tin designs Optimizing the Mobile Site Experience: Through digital analytics I can focus just on mobile browsers and look at fallout.
70% of visitors leave at this fist page, possibly due to no clear order now link For the 30% of visitors who remain 20% click tin designs • From that 20% remaining, I lose 40% of them because the form requires a company name Optimizing the Mobile Site Experience: Through digital analytics I can focus just on mobile browsers and look at fallout.
Optimizing the Mobile Site Experience: Through digital analytics I can focus just on mobile browsers and look at fallout.
How to Approach Digital Analytics • What are your business objectives/desired outcomes? • What are the associated goals? • What KPIs are you going to use to measure your performance? • What KPI targets do you need to meet to be successful? Business Objectives Goals KPIs Objectives must be DUMB: Doable Understandable Manageable Beneficial Source: AvinashKaushik, http://www.kaushik.net/avinash/web-analytics-101-definitions-goals-metrics-kpis-dimensions-targets/, 2010
How to Approach Digital Analytics Business Objective Goal KPI KPI Target Increase Net New Accounts • Lift in online application completion rate • 5% • Increase online applications Increase Account Balances • Improve conversions from “abandoned carts” • Lift in conversion from triggered events • 10% Increase Customer Satisfaction • Understand the top content for high valued clients • Top content viewed by high value clients, based on recency and frequency views • 10%
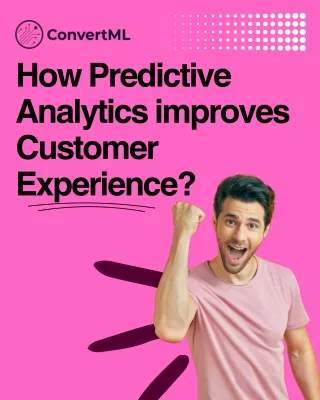
So… how can digital analytics enhance the customer experience and the bottom line?
Why companies aren’t doing more with digital analytics? A recent Forrester study found that 59% of interactive marketers surveyed wanted a “better system for measuring and analyzing the performance of programs that encompass multiple channels.” Source: Forbes http://www.forbes.com/sites/davidwilliams/2012/04/16/if-you-think-a-web-analytics-tool-is-enough-think-again/2/ 2012
Common Challenges to Understanding the Customer Experience and Leveraging Digital Analytics
Digital Analytics Tools Social • Radian6 • AlterianSM2 • MNIncite Digital Analytics • Adobe Digital Marketing Suite • Web Trends • Enterprise Marketing Mgmt(Core Metrics / Tea Leaf) • Tableau Competitive Insights • Compete • Quantcast • Insights for Search • DoubleClick Ad Planner Web Analytics & Tag Management • Google Analytics (Premium) • Crazy Egg • Analytics Canvas Testing • Google Website Optimizer • Adobe Test and Target • Optimizely • ClickTale • Keynote DeviceAnywhere Mobile • Flurry • Bango • AdMob Analytics • Litmus • Localytics Voice of Customer / Text Analytics • 4Q by iPerceptions • KissInsights • UserTesting.com • Concept Feedback • Clarabridge • OpinionLab Sources: AvinashKaushikhttp://www.kaushik.net/avinash/best-web-analytics-tools-quantitative-qualitative/ 2010 INC. Best web analytic tools http://www.inccom/guides/12/2010/11-best-web-analytics-tools.html 2010 Compare analytics tools at www.aboutanalytics.com
The Intersection Between Digital Analytics & the Customer Experience
Understand the click stream overtime of my visitors Using Content Preferences for Up-Sell:Sample Customer Experience Desired Outcome:Increase Magazine Subscriptions Goal: Convert online website visitors to offline subscribers KPI: Magazine subscriptions from online subscribers Through digital analytics I could …
Understand the click stream overtime my visitors • Could test or populate homepage content based on what they last viewed Using Content Preferences for Up-Sell: Through digital analytics I could …
Understand the click stream over time my visitors Could test or populate homepage content based on what they last viewed Using Content Preferences for Up-Sell: Through digital analytics I could …
1.800.Flowers.com Case Study Measuring the performance of banner ads as e-commerce sites
Integrating Email, Site, and Display: Sample Customer Experience Desired Outcome: Increase revenue Goal: Increase website bookings KPI: Look to book ratio Digital analytics helps me know: 15% of recipients opened the email, and 20% of those clicked on either the “Book” or destination content links
Integrating Email, Site, and Display: Digital analytics helps me know: 15% of recipients opened the email, and 20% of those clicked on either the “Book” or destination content links Dates searched and fares displayed. 40% of those clicking through from the email search fares but don’t book.
Integrating Email, Site, and Display: Digital analytics helps me know: 40% of email recipients open and 30% of openers click a link. 50% of clicks are on the YouTube link. 7% of openers book a trip. 15% of recipients opened the email, and 20% of those clicked on either the “Book” or destination content links Dates searched and fares displayed. 40% of those clicking through from the email search fares but don’t book .
Integrating Email, Site, and Display: Digital analytics helps me know: 40% of email recipients open and 30% of openers click a link. 50% of clicks are on the YouTube link. 7% of openers book a trip. 15% of recipients opened the email, and 20% of those clicked on either the “Book” or destination content links The targeted AA.com site messaging generates a 7% click through rate. Overall, remarketing messaging drives a 15% increase in bookings. Dates searched and fares displayed. 40% of those clicking through from the email search fares but don’t book .
Sun Case Study Optimizing video content on the web for the company and the consumer
Our Approach Goal: Develop a framework in support of a digital analytics solution that delivers a great customer experience and improves the bottom line
Step 1 - Determine the desired outcome, shared goals & KPIs Business Objective Goal KPI KPI Target Increase Net New Accounts • Lift in online application completion rate • 5% • Increase online applications Increase Account Balances • Improve conversions from “abandoned carts” • Lift in conversion from triggered events • 10% Increase Customer Satisfaction • Understand the top content for high valued clients • Top content viewed by high value clients, based on recency and frequency views • 10%
Step 2 - The Current State Current Org State: Goals, metrics and data are siloed by channel and line of business • email, web (content/commerce), mobile, social, voice of the customer, • consumer, small business, web only • looking at clicks, opens, visitors, followers Current Tech State: Lack of data and systems integration • Google Analytics and SiteCatalyst for web • Flurry for mobile • Clarabridge for text analytics • Radian6 for social
Step 3 - Fictional Use Case Optimizing the Online Account Application A – Fund your account page with an optional funding feature 1,500 new online account applicants per day (Optional) A Text and speech analytics & social media chatter reveal primary reason for abandonment at this page is due to unwillingness to commit funds right away A/B Test Engine OLA drop off at this page now cut in half. 45 extra applications per day completed and funded within 3 days. Avg new account funding = $2,000 Incr assets over 30 days = $2.7MM Prospect abandons the application at the “Fund the account page”. B – Status Quo B 30% online application drop off rate = 450 20% of drop offs occur above page 3 = 90 All fictional OLA statistics provided by digital analytics solution Average funding amounts provided by linkage of information in EDW and digital analytics solution
Step 4 - Business Requirements for True Multichannel, Customer-Centric Digital Analytics
So… Digital Analytics can: • Improve customer experience, • Which can improve your bottom line But with that, keep in mind: • Focus on outcomes, not just metrics • It is as much about the implementation as strategy • There is no magic tool that gives you everything
How to Get Started - Strategic Value Assessment What is an SVA? • Is a data-driven assessment of your online analytics goals and objectives from a business, marketing and web executive's point of view.
For More Information Kelsey A. HorineSenior Web Analytics Consultant P 303.410.5272 C 970.485.2828 Khorine@epsilon.com www.epsilon.com