Download

1 / 6
60 likes | 238 Views
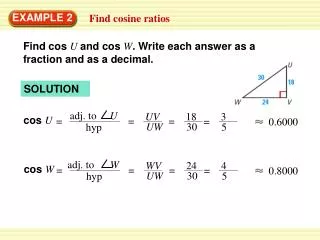
Biology. The stem-and-leaf plot at the right shows the lengths, in millimeters, of fish in a tank. Use the stem-and-leaf plot to describe the data. What interval includes the most lengths?. 4 9 5 7 7 9 6 1 2 4 4 7 8 8 9 7 6 8 4 Key : 6 8 = 68. Interpreting a Stem-and-Leaf Plot.

E N D
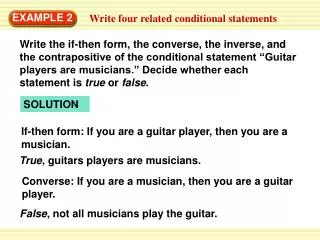
Biology The stem-and-leaf plot at the right shows the lengths, in millimeters, of fish in a tank. Use the stem-and-leaf plot to describe the data. What interval includes the most lengths? • 4 9 • 5 7 7 9 • 6 1 2 4 4 7 8 8 9 • 7 6 8 • 4 • Key : 6 8 = 68 Interpreting a Stem-and-Leaf Plot EXAMPLE 2 SOLUTION The longest fish is 84millimeters and the shortest fish is 49 millimeters. So the range of lengths is 35 millimeters. Most of the lengths are in the 60–69 interval.
Making a Double Stem-and-Leaf Plot EXAMPLE 3 Test Scores The data below show the test scores for Beth’s class and Marisa’s class. Overall, which class had the better test scores? Beth’s class:95, 86, 79, 79, 58, 68, 90, 63, 71, 81, 82, 94, 64, 76, 77, 79, 83, 91, 83, 68, 74, 71 Marisa’s class:95, 73, 76, 84, 84, 89, 67, 82, 88, 86, 93, 97, 96, 84, 60, 75, 91, 87, 89, 86, 76, 93
5 6 0 7 7 3 5 6 6 8 2 4 4 4 6 6 7 8 9 9 9 1 3 3 5 6 7 8 8 8 4 3 9 9 9 7 6 4 1 1 6 3 3 2 1 5 4 1 0 Key:0 91represents90and91 Making a Double Stem-and-Leaf Plot EXAMPLE 3 SOLUTION You can use a double stem-and-leaf plot to compare the test scores. Beth’s Class Marisa’s Class
ANSWER Marisa’s class had better scores, because her class had more scores in the eighties and nineties. Making a Double Stem-and-Leaf Plot EXAMPLE 3
2. Make an ordered double stem-and-leaf plot to compare the lengths, in minutes, of the last 15 phone calls made by two friends. In general, who made longer calls, Kenyon or Jason? Justify your reasoning. for Examples 2 and 3 GUIDED PRACTICE Kenyon: 8, 12, 8, 17, 5, 28, 16, 23, 29, 14, 21, 34, 16, 28, 31 Jason:31, 16, 24, 28, 7, 12, 5, 11, 5, 13, 14, 6, 11, 19, 24
ANSWER Kenyon made longer phone calls because he had more calls in the twenties and the thirties for Examples 2 and 3 GUIDED PRACTICE