Using the Electromagnetic Spectrum
This educational resource guides students in understanding the significance of observing the universe using various wavelengths of the electromagnetic spectrum. By examining real astronomical images from instruments like the Chandra X-Ray Telescope and the Hubble Space Telescope, students will learn to relate wavelength, frequency, and energy. They will discover how different observations provide unique information about celestial objects, emphasizing the importance of multiple perspectives in astronomy.

Using the Electromagnetic Spectrum
E N D
Presentation Transcript
Using the Electromagnetic Spectrum Objective: Students will explain the need for observing the universe using different wavelengths and will be able to relate wavelength, frequency, and energy
Why look at the Universe through different wavelengths? We get different information depending on how we observe it. Think of what different things you learn by using different senses when exploring something. Smell touch Taste Sound Sight
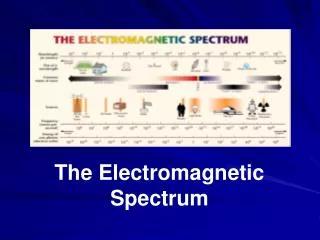
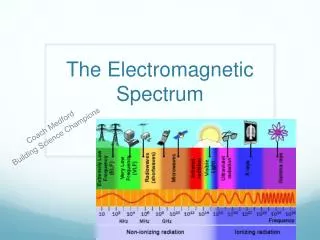
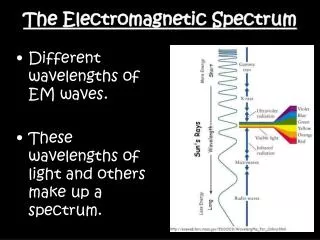
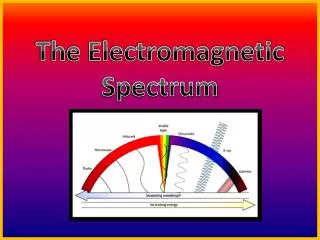
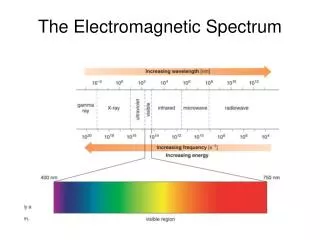
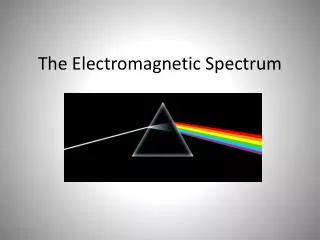
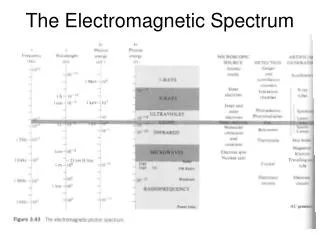
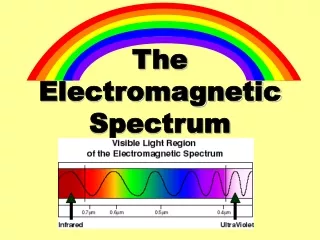
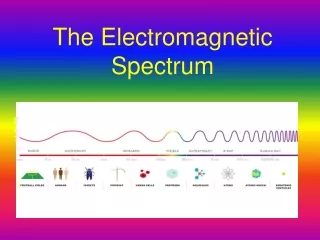
Wavelength, Frequency, and Energy Notice how small is the visible light section of the entire EM spectrum.
Crab Nebula as seen from different wavelengths The new Chandra X-Ray Telescope has recorded detailed pictures of the heart of the Crab Nebula, first seen on Earth in the year 1054. Here are pictures of the Crab at x- ray (Chandra), optical (Palomar), infrared (Keck), and radio (VLA) wavelengths.
Arecibo Observatory - Radio Puerto Rico- The observatory's 1,000 ft (305 m) radio telescope is the world's largest single-aperture telescope.
The Very Large Array - Radio New Mexico - The observatory consists of 27 independent antennas, each of which has a dish diameter of 25 meters (82 feet) and weighs 209 metric tons. The antennas are arrayed along the three arms of a Y-shape (each of which measures 13 miles long)
South Pole Telescope - Microwave Antarctica – A 10 meter diameter designed for observations in the microwave region, with the particular design goal of measuring the faint, diffuse emission from the cosmic microwave background.
W.M. Keck Observatory – Vis, IR Hawaii –at the summit of Hawaii’s dormant Mauna Kea volcano It has twin telescopes -optical & infrared. The telescopes operate together to form a single image
Images from Keck On left: Mosaic false-color image of thermal heat emission from Saturn and its rings. The black square at 4 o'clock represents missing data.
Spitzer Space Telescope - IR Space - The Spitzer Space Telescope is an infrared space observatory launched in 2003
Images from Spitzer The Helix Nebula, often photographed for its colors and resemblance to a giant eye.
Image from Spitzer Images of the stormy atmosphere of a brown dwarf, creating a detailed "weather map“ for this class of cool, star-like orbs. (This image is a composite of Spitzer and Hubble data.)
Palomar Observatory - Visible California - this observatory operates several telescopes, including the famous 200-inch Hale Telescope (5.1 m)
Images from Palomar On right: IC 410, IC 405 (Flaming Star Nebula), and environs. This image is a composite from B&W images. The images were recorded on 2 types of photographic plates, one sensitive to red light and the other to blue, and then digitized. Credit: David De Martin
Hubble Space Telescope – Visible, UV Space- This telescope was carried into a low earth orbit by the space shuttle in 1990. Hubble's four main instruments observe in the near UV, Visible, and Near IR.
Images from Hubble • image of the nearby spiral galaxy Messier 74. Bright knots of glowing gas light up the spiral arms; regions of new star birth shining in pink. • On right- this is commonly known as the Sombrero galaxy because in visible light, it resembles the broad-brimmed Mexican hat. However, in Spitzer's IR view, the galaxy looks more like a "bull's eye.“ This image is a composite of both telescopes.
Chandra X-ray Observatory Space - The Chandra X-ray Observatory is the world's most powerful X-ray telescope. Since the earth’s atmosphere absorbs the vast majority of X-rays, they are not detectable from Earth-based telescopes.
Images from Chandra “Chandra has allowed astronomers to watch a young neutron star cool steadily over time. By giving us a snapshot of the temperature roughly every two years for the past decade.
Compton Gamma Ray Observator Space – operated in Earth’s orbit from 1991 to 2000. It featured four telescopes in one spacecraft covering x-rays and gamma-rays
Images from Compton This computer processed image represents a map of the entire sky. These gamma-ray photons are more than 40 million times more energetic than visible light photons and are blocked from the Earth's surface by the atmosphere. A diffuse gamma-ray glow from the plane of our Milky Way Galaxy is clearly seen across the middle.
Why are all these telescopes in space, or remote places on Earth? Because astronomers are anti social. Because astronomers like to go to exotic places to do their work. To reduce the interference from the atmosphere and the electromagnetic signals from human activity.
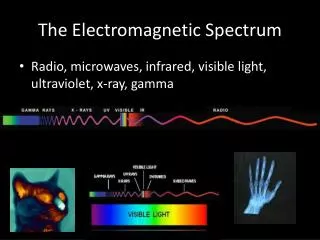
The Electromagnetic Spectrum Let’s learn some details! You need to memorize these in order!
Speed of Light All light travels at the speed of light (c) which is: C= 3.0 X 10⁸ meter/sec or 186,000 miles/sec
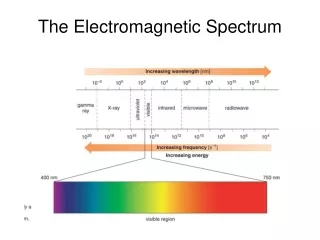
Wavelength, Frequency, and Energy Wavelength – The distance from one point on a wave to the same point on the next wave. (Symbol =λ ) The units are in meters. It can be kilometers to picometers. Frequency – The number of waves that pass by in a given time period .(Symbol = ν or f ) The units are 1/sec or hertz (Hz) As the wavelength increases, the frequency decreases (& vice versa). They are INVERSELY related through the equation: c=
Energy Light with the highest energy has the highest frequency,but thesmallest wavelength. The equation that relates energy to frequency is E = h where h= 6.626 X 10⁻³⁴ Jsec
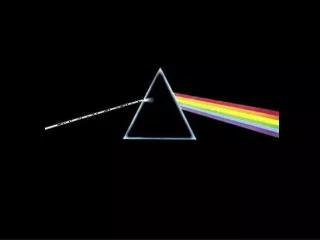
Which color light has the longest wavelength? • Red • Green C) Blue • Which color light has the highest frequency? • Red • Green C) Blue 3. Which color light has the highest energy? • Red • Green • Blue 4. Which color lighthas the greatest speed? • Red • Green C) Blue