Download
1 / 26
260 likes | 374 Views
The Wavelet Tutorial. Dr. Charturong Tantibundhit. What is a transform?. Mathematical transformations are applied to signals to obtain a further information from that signal that is not readily available in the raw signal.

E N D
The Wavelet Tutorial Dr. Charturong Tantibundhit
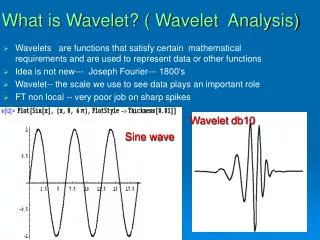
What is a transform? • Mathematical transformations are applied to signals to obtain a further information from that signal that is not readily available in the raw signal. • In the following tutorial, I will assume a time-domain signal as a raw signal, and a signal that has been "transformed" by any of the available mathematical transformations as a processed signal
time-amplitude representation In many cases, the most distinguished information is hidden in the frequency content of the signal The frequency SPECTRUM of a signal is basically the frequency components (spectral components) of that signal. Time-Domain
Spectrum The Fourier transform (FT) of the 50 Hz signal given in previous figure
Transforms • FT is probably the most popular transform being used. • Many other transforms are used quite often by engineers and mathematicians • Hilbert transform • Short-time Fourier transform (STFT) • Wigner distributions • Wavelet transform
Fourier Transform (FT) • FT is a reversible transform • No frequency information is available in the time-domain signal • No time information is available in the Fourier transformed signal • Is that is it necessary to have both the time and the frequency information at the same time? • This information is not required when the signal is so-called stationary
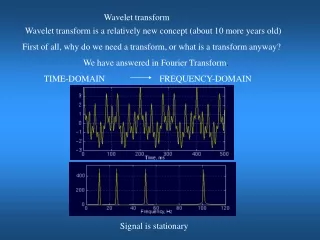
Stationary Signals • Signals whose frequency content do not change in time • x(t)=cos(2*pi*10*t)+cos(2*pi*25*t)+cos(2*pi*50*t)+cos(2*pi*100*t)
Non-Stationary Signals • A signal whose frequency changes in time • Ex. Chirp signal
Multiple Freq Presented Different Time The interval 0 to 300 ms has a 100 Hz sinusoid, the interval 300 to 600 ms has a 50 Hz sinusoid, the interval 600 to 800 ms has a 25 Hz sinusoid, and finally the interval 800 to 1000 ms has a 10 Hz sinusoid
FT is not a suitable technique for non-stationary signal • FT gives what frequency components (spectral components) exist in the signal. Nothing more, nothing less. • When the time localization of the spectral components are needed, a transform giving the TIME-FREQUENCY REPRESENTATION of the signal is needed
Wavelet Transform • Provides the time-frequency representation • Capable of providing the time and frequency information simultaneously • WT was developed to overcome some resolution related problems of the STFT • We pass the time-domain signal from various highpass and low pass filters, which filters out either high frequency or low frequency portions of the signal. This procedure is repeated, every time some portion of the signal corresponding to some frequencies being removed from the signal
Uncertainty Principle • We cannot exactly know what frequency exists at what time instance , but we can only know what frequency bands exist at what time intervals • This is a problem of resolution, and it is the main reason why researchers have switched to WT from STFT • The main reason why researchers have switched to WT from STFT. STFT gives a fixed resolution at all times, whereas WT gives a variable resolution
Wavelet Transform • Higher frequencies are better resolved in time, and lower frequencies are better resolved in frequency • A certain high frequency component can be located better in time (with less relative error) than a low frequency component • A low frequency component can be located better in frequency compared to high frequency component
Fourier Transform • The information provided by the integral, corresponds to all time instances • whether the frequency component "f" appears at time t1 or t2 , it will have the same effect on the integration
x(t)=cos(2*pi*5*t)+cos(2*pi*10*t)+cos(2*pi*20*t) • +cos(2*pi*50*t)
Sort-Time Fourier Transform (STFT) • How are we going to insert this time business into our frequency plots • Can we assume that, some portion of a non-stationary signal is stationary? • The signal is stationary every 250 time unit intervals (previous figure) • If this region where the signal can be assumed to be stationary is too small, then we look at that signal from narrow windows, narrow enough that the portion of the signal seen from these windows are indeed stationary
STFT • In STFT, the signal is divided into small enough segments, where these segments (portions) of the signal can be assumed to be stationary • A window function "w" is chosen. The width of this window must be equal to the segment of the signal where its stationarity is valid
If we use a window of infinite length, we get the FT, which gives perfect frequency resolution, but no time information • The narrower we make the window, the better the time resolution, and better the assumption of stationarity, but poorer the frequency resolution • Narrow window ===>good time resolution, poor frequency resolution. • Wide window ===>good frequency resolution, poor time resolution.
Different Window Sizes • w(t)=exp(-a*(t^2)/2)