Download
1 / 21
220 likes | 357 Views
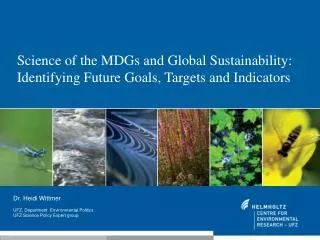
and Ecological Fiscal Transfers:. Chronically Underfinanced – Mobilization of Additional Resources for Biodiversity, Workshop, 30 January 2010, Bonn Payments for Environmental Services Examples and perspectives for the future. Irene Ring Department of Economics, UFZ. Outline.

E N D
and Ecological Fiscal Transfers: Chronically Underfinanced – Mobilization of Additional Resources for Biodiversity, Workshop, 30 January 2010, BonnPayments for Environmental Services Examples and perspectives for the future Irene Ring Department of Economics, UFZ
Outline Introduction: TEEB Background Payments for Environmental Services (PES) Ecological fiscal transfers (EFT) International PES, REDD+ and EFT Conclusions
About TEEB… About TEEB… An “Open Architecture” project… over 500 contributors across partner institutions, universities, individuals… An international and diverse “Community” of economists and ecologists… Makers of “Global Public Goods”: the TEEB Report suite Some of our key partners…. 3
TEEB D1: TEEB for International and National Policy Makers • Part I The need for action • Chapter 1 The global biodiversity crisis and related policy challenge • Chapter 2 Framework and guiding principles for the policy response • Part II Measuring what we manage: information tools for decision-makers • Chapter 3 Strengthening indicators and accounting systems for natural capital • Chapter 4 Integrating ecosystem and biodiversity values into policy assessment • Part III Available solutions: instruments for better stewardship of natural capital • Chapter 5 Rewarding benefits through payments and markets • Chapter 6 Reforming subsidies • Chapter 7 Addressing losses through regulation and pricing • Chapter 8 Recognising the value of protected areas • Chapter 9 Investing in ecological infrastructure • Part IV The road ahead • Chapter 10 Responding to the value of nature Available at www.teebweb.org
Payments for Environmental Services • A voluntary transaction where a well-defined ecosystem service (ES) (or land use likely to secure that service) is ‘bought’ by at least one ES buyer from at least one ES provider, if and only if the ES provider secures ES provision (conditionality). (adapted from Wunder 2005) • Broad range of schemes for various ecosystem services and land uses in many countries and at different spatial scales:Public, public-private and private schemes at local, regional and national levels. • Important: regulatory baselines and additionality – PES will always be part of a policy mix!
PES: Opportunities and Challenges • PES can help make the value of ES more explicit and thus modify and potentially reverse incentives for resource users • Sequence of measures: First, remove perverse subsidies! • Voluntariness is a key feature – but legal/regulatory underpinning essential • Potential to scale up existing PES, e.g. from local initiatives to national coverage, and to implement them in more countries. • PES schemes face constraints: • investment in information and capacity building, e.g., mapping supply and demand of ES, engaging stakeholders, training administrators • PES are not appropriate everywhere: need of sufficiently defined resource tenure and use rights, equal bargaining power between stakeholders
PES example: Costa Rica • Among the first national PES programmes in developing countries • Well-cited example, but therefore also well-studied and permanently improved • Set up in 1997, it remunerates landholders for providing carbon sequestration services, hydrological services, for preserving biodiversity and landscape beauty. • Source of funds: national (fossil fuel tax) and international (Norway, World Bank, GEF, KfW) – partly IPES
Challenge:Land-usetransition ’path dependency’’ MACRO NATIONAL LANDSCAPE & FOREST STAND Forest cover Stage 4: Increasing forest cover and quality due to afforestation and reforestation Stage 3: Forest mosaics with stabilised cover; (low or zero net deforestation) Stage 2: Forest frontiers; high deforestation/ extraction rates. Stage 1: Undisturbed/little disturbed forests FOREST TRANSITION STAGES Time / Space Sources: Flores Rodas, 1985; MINAE; FONAFIFO n.y. in Kleinn et al. 2002; CATIEDavid Barton, NINA.
Recent review: Some propositions PES is more effective in promoting forest recovery than preventing deforestation (Sanchez-Azofeifa et al. 2003; Arriagada 2008) PES is only cost-effective in the last stages of the forest transition, in a landscape mosaic with land-use specialisation at forest stand level (García-Fernández et al. 2008) Land cover, land use and institutional contexts appropriate for PES represent a minor part landscape and biodiversity variation under threat. Protected area buffer zones play a key role in increasing PES effectiveness (Calvo-Alvarado et al. 2008) Carefully check where use of PES is most (cost-)effective! Role of spatial targeting
Another Challenge: Addressing the opportunity cost of conservation of both private and public actors PES literature has largely increased in recent years Focus on the opportunity cost of conservation for land users: local private actors Largely missing: Addressing the opportunity cost of conservation for local public actors However, municipalities and local communities are important actors for implementing conservation policies at the local level (spatial planning, PAs as development obstacle) Ecological fiscal transfers as a suitable instrument: Include ecological indicators into intergovernmental fiscal transfers to the local level
e.g., Governmental levels in the German or Brazilian federal systems: Federal States Local Intergovernmental fiscal transfers Distribution to state and local levels Taxes Public revenues Fiscal transfers tothe local level
Fiscal transfer systems to the local level Substantial source of income for municipalities: 30% in West-Germany, 50% in East-Germany Fiscal compensation today: Urban agglomerations Rural and remote areas Not considered: Ecological servicesinvolving spatial externalities: spillover benefits
* or commonly also called: Ecological value-added tax Ecological fiscal transfers – Experiences • Portugal: since 2007, under investigation • Brazil: since 1992, has gained positive experiences with ecological fiscal transfers: ICMS-Ecológico • Compensation for land-use restrictions • Incentive to create and maintain protected areas
Ecological indicators • “Conservation Units”: officially registered protected areas for nature and biodiversity conservation • Watershed protection areas • Solid waste disposal • Sanitation systems and sewage disposal • Slashing and burning control • Soil protection • Local environmental policy States with ICMS-E legislation in Brazil (2008)
Paraná: Increase in conservation units APAs (Environmental Protection Areas) can be designated at federal, state or municipal level. RPPNs (Private Natural Patrimony Reserves) can be designated at federal or state level. Source: May et al. 2002; Ring 2008
Fiscal effects of ICMS-E on municipal budget • Paraná: 1994 – 2000 50 Mio. R$ annually 06/2001: • São Paulo: 1994 – 1996 23 Mio. R$ annually R$ 1,00 = • Minas Gerais: 1998 – 2000 15 Mio. R$ annually US$ 0,41 • Paraná: • Piraquara (100% water reserves + CUs): local income increased by 84% until 1995 • São Jorge do Patrocínio (52% CUs): 71% of ICMS transfers based on CUs (2000) • Minas Gerais: • Marliéria (55% CUs): 68% of ICMS transfers based on CUs; Increase of transfers from R$ 36.648 (1995 before ICMS-E) to R$ 811.335 (1996 after implementation of ICMS-E)
Transfer potential of Brazilian model to Germany Consideration of conservation areas within the intergovernmental transfer system to the local level – possible scenarios: Brazilian model: Alternatively: Set aside a definite budget in advance and allocate according to share of conservation units within municipal territory Consideration of conservation units as part of the additional approach to allocate lump-sum transfers (analogous to area, pupils, etc.) Corresponding scenarios are calculated at UFZ for the Free State of Saxony
KFA Saxony 2002 - Scenario 1: Lump-sum transfers considering conservation units Percentage change of general lump-sum transfers in Saxony 1 ha Conservation unit = 1 inhabitant GIS: A. Kindler & H. Hartmann
KFA Saxony 2002 - Scenario 2: 90 Mio. € set aside for conservation Relative change of unconditional conservation transfers and lump-sum transfers in Saxony [%] 90 Mio. Euro set aside for conservation (corresponds to compensation of road burden) GIS: A. Kindler & H. Hartmann
Ecological fiscal transfers: A promising way to go? • International transfers (IPES),e.g., Indonesia: Role of local governments in forest conservation. Need to combine REDD and fiscal transfers to the local level based on cost and benefits of forest conservation. • National scale,e.g., Portugal, communal financing law Since 1 Jan. 2007: introduced Natura 2000 and other protected areas as indicators for fiscal transfers from the national level to municipalities. • State level,e.g., the ICMS-Ecológico in Brazil, acknowledging conservation units for redistribution of state value-added tax revenues to local governments
Conclusions: Challenges and prospects PES • Transfer and upscaling of successful schemes • Consider constraints, policy mix and check applicability Ecological fiscal transfers • Adress local governments in their role for biodiversity conservation and protected area management • Brazil/Portugal: Transferability of approach to other countries International PES and national REDD(+) implementation • combine biodiversity conservation & climate mitigation policies • careful checking of co-benefits • go for broader range of actors and instruments • do not forget local governments – role of ecological fiscal transfers!