Download
1 / 60
600 likes | 735 Views
Syllabus week theme --------------------------------------------------------------------------------------------------------------------- Statistics of stars, spectroscopy, HR diagram. The star formation and evolution. Hyashi line.

E N D
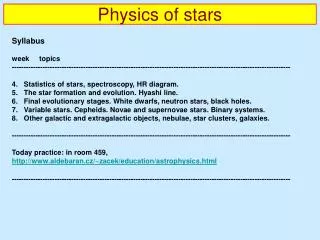
Syllabus • week theme • --------------------------------------------------------------------------------------------------------------------- • Statistics of stars, spectroscopy, HR diagram. • The star formation and evolution. Hyashi line. • Final evolutionary stages. White dwarfs, neutron stars, black holes. • Variable stars. Cepheids. Novae and supernovae stars. Binary systems. • Other galactic and extragalactic objects, nebulae, star clusters, galaxies. • --------------------------------------------------------------------------------------------------------------------- Physics of stars
Spectroscopy Spectroscopy:The study of the nature of stars and other objects by analysing the light or other radiation they produce - their spectrum. Traditionally, spectroscopy dealt with visible light, but it has been extended to cover other wavelengths of electromagnetic radiation and even to measurements of the distribution of energy among particles, such as cosmic rays. The first spectroscopy does is to tell us what stars , galaxies and so on are made of. It does this because the atoms of each kind of element produce their own characteristic features in the spectrum, called lines. When atoms emit or absorb energy in the form of light, they do so only at very well-defined wavelengths, which correspond to changes in the arrangement of the electrons that surround the nucleus of the atom. A convenient way to picture this is to think of an electron in particular energy state, sitting on one step on a staircase. If the electron jumps down to the next step, to a state of lower energy, it emits a quantum of electromagnetic radiation with a wavelength determined by the height of the step. An electron on a lower step can also jump up to a higher step, but only by absorbing precisely the right quantum of energy to make the jump. Emission produces a bright line in spectrum, while absorption produces a dark line in the spectrum where electrons have 'stolen' energy from a background source of light. Some sources also produce a continuous spectrum of energy with a characteristic shape - the two most important examples are black body radiation and synchrotron radiation. Black body radiation is actually made up from a combination of many wavelengths of radiation added together in accordance with the quantum rules, while synchrotron radiation is produced by electrons moving freely in a magnetic field, not attached to atoms.
Spectroscopy - principle Origin of spectral absorption lines http://www.ap.stmarys.ca/~ishort/Astro/
Spectroscopy All of this behaviour is extremely well understood and is described beautifully by a quantum theory. But you do not need quantum theory in order to make use of spectroscopy. All you need is the knowledge, gained from observations in the laboratory, that each atom absorb and emits light of particular colour (a particular wavelength), or colours. Sodium, for example, radiates strongly at two precise wavelengths in the orange part of the spectrum when the atoms are heated and simulated by an electric discharge; this is what gives many street lights their characteristic orange-yellow colour. Equally, if white light is shone through a substance that contains sodium (perhaps dissolved in a liquid), there will be dark lines in the appropriate part of the spectrum of the light, where the sodium has absorbed energy. The sodium spectrum http://web.physik.rwth-aachen.de/~harm/aixphysik/atom/discharge/index.html The sodium dublet, http://hyperphysics.phy-astr.gsu.edu/hbase/quantum/sodzee.html
Spectroscopy – brief history The key discovery that led to the development of spectroscopy was made by the German physicist Josef von Fraunhofer (1787-1826) in 1814. He was the first person to study the rainbow pattern produced by passing light through a prism in detail under intense magnification. He was actually interested in the properties of the glass in the prisms, and how in affected the light, but to his surprise he discovered that there are many dark lines in the spectrum of white light, including light from the Sun. A few of these dark lines in the solar spectrum, now known as Fraunhofer lines, had been noticed earlier by the English physician and physicist William Wollaston (1766-1828) in 1802 but their significance had not been appreciated then Fraunhoffer knew nothing of Wollaston's discovery. Fraunhofer soon counted 574 lines in the solar spectrum, and found many of the same lines in light from Venus and form many stars. An explanation of the Faunhofer lines as due to absorption of light by different elements present in the Sun's atmosphere was published by the German scientist Gustav Kirchhoff (1824-87) in 1859. He went on to formulate the basics principles of spectroscopy, working together with Robert Bunsen (1811-99) at the end of the 1850s. It is no coincidence that this is the same Bunsen whose name is linked with that of the eponymous burner (although the 'Bunsen Burner' is actually a modification, made by one of Bunsen's assistant, of a device invented by Michael Faraday). The burner provides a clean, hot flame in which different substances can be heated until they glow (or burn), radiating light at their own characteristic spectral wavelengths, which can be studied and analysed. The technique soon led to the discovery of previously unknown elements, and the value of spectroscopy to astronomy was spectacularly demonstrated a few years later, when Norman Lockyer found a new element, helium, by analysing the spectrum of light from the Sun. For a particular element, the bright lines produced by a hot sample are at exactly the same wavelengths as the dark lines produced when light passes through a cold sample.
Spectroscopy – solar spectra Detailed Frauenhofer spectra of Sun http://www.physics.unlv.edu/~jeffery/astro/astro1/lec007.html
Spectroscopy – solar spectra The typical graph of spectra (Sun, UV from380 nm to 419 nm) http://www.coseti.org/solatype.htm
Spectroscopy – applications Spectra of stars and galaxies are obtained by using prisms attached to telescopes to split the incoming light into its rainbow pattern - a technique which goes right back to Isaac Newton's discovery that light can be split into its component colours in this way. The spectrum can then be photographed and studied in detail. The positions and strengths of the lines in the spectrum can also be determined electronically, using suitable detectors attached directly to the telescopes or designed to pull out information from the photographic plates. Such spectra may show many bright lines, corresponding to emission of light by atoms in a hot region at the surface of the star, and also many dark lines, corresponding to absorption by atoms in cooler regions, further out from the surface of the star or in clouds of gas and dust in space. These can be compared with spectra obtained in the laboratory to find out exactly which elements are doing the absorbing and emitting. This directly reveals which elements are present in the objects being studied. The pattern of lines produced by each element is as distinctive as fingerprint, and gives an unambiguous identification. By measuring the strengths of the different lines in the spectrum, astrophysicists can work out how hot (or cold) the material producing the lines is (as well as what it is made of), while by measuring the displacement of the pattern of spectral lines towards the blue end of the spectrum or towards to the red end of the spectrum they can use the Doppler effect to work out how fast a star is mowing towards or away from us. Applying this technique to galaxies seen edge on, they can work out how fast the galaxies are rotating, and the cosmological redshift tells us how fast the Universe is expanding. Molecules also produce characteristic spectral signatures, often in the millimetre part of the spectrum, while very energetic sources produce characteristic spectral signatures at X-ray and gamma ray wavelengths.
Spectroscopy – summary • A single spectrum can tell us: • what astronomical object is made of, • how hot it is, and • how is moving. Spectroscopy is the single most important tool used in astronomy and (especially) astrophysics, and without spectroscopy we would essentially know nothing about the Universe except for the positions of stars and galaxies on the sky. http://www.ap.stmarys.ca/~ishort/Astro/
Spectral classification of stars … is a refinement of the classification of stars by their colour, using detailed studies of the spectrum of their starlight. The basic classification scheme developed by Henry Draper at Harvard was refined early in the 20th century into a classification which labelled stars according to their spectra and colours as O, B, A, F, G and M in decreasing order of the temperature. O stars, at one extreme of the classification, are blue-white and show features due to ionized helium in their spectra; G stars, which are much cooler and orange-yellow in colour, show strong lines associated with ionized calcium, and lines of metals such as iron. As spectroscopic techniques improved, it became possible to subdivide the seven main classes of the Harvard sequence, so that the Sun, for example, is not just a G star but is classified as G2V. And when it turned out that some cool stars have strong absorption feature in their spectra that are not seen in other stars of the same colour, three new classes, R, N and S were added to the cool end of the Harvard classification. Additional information about the star in question is given by other code letters in the modern development of the Harvard classification, called the MK system. This means that to an expert the code giving the classification of star contains a wealth of information; for the armchair cosmologist, however, the original Harvard classification is all you need to worry about. More detailed information about spectral clasification of stars: http://www.utpa.edu/dept/physci/labs/astr1402/lab2i.pdf
Spectral classification of stars eSky project: http://www.glyphweb.com/esky/concepts/spectralclassification.html
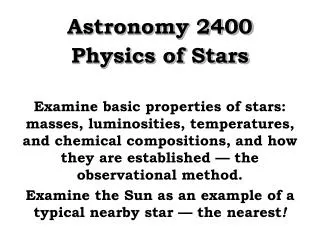
Now we know following quantities as main characteristics of the stars: • absolute brightness (calculated from the apparent magnitude and the distance) • temperature (from the spectra). • Is there any dependence between them? Statistics of stars • Hertzprung-Russell diagram • Hans Rosenberg (1879-1940), • Ejnar Hertzsprung (1873-1965), • 1913 Henry Norris Russell (1877-1939) Set of stars
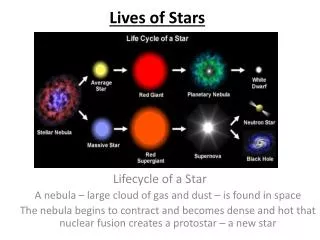
HR diagram ↑H-R diagram of stars from Hiparcos catalogue ←Names of characteristic branches in H-R diagram http://en.wikipedia.org/wiki/Stellar_classification
HR diagram Hertzprung –Russel diagram: A kind of graph in which the temperature (or colour) of each star is plotted against its absolute magnitude. The position of the star in the Hertzprung-Russel diagram depends on its mass and its age, and studies of the way stars are distributed on the diagram help astrophysicists to work out how stars evolve. History: The potential value of such diagram in studying the nature of stars was first appreciated by Ejnar Hertzprung, working in Copenhagen in the first decade of the 20th century. His version was published in 1911, although it was derived from work published several years earlier. The same idea was arrived at independently by Henry Norris Russel, working in Princeton, who published his version in 1913. Hertzprung and Russel never worked together on the idea.
HR diagram The essential feature of the H-R diagram is that it relates the colour of a star to its brightness. Brightness is measured 'across the page' (the y-axis), while temperature is measured 'across the page' (the x-axis), with the peculiarity that cooler stars are further to the right in the diagram. This way of measuring temperature is chosen because essentially it means that from left to right across the H-R diagram the colours of the stars correspond to the sequence O B A F G K M in the classification developed by Annie Jump Cannon. Stars in the bottom right of the H-R diagram are faint, cool and red (with temperature below 3,500 K), while stars in the top left of the diagram are bright, hot and blue white (with temperature above 25,000 K). Most visible stars lie on a band running from top left to bottom right in the diagram, which is called the main sequence. This corresponds to all the stars that, like the Sun, get their energy from the fusion of hydrogen nuclei into helium nuclei in their centres. Radius and Temperature of Main Sequence Stars: http://demonstrations.wolfram.com/RadiusAndTemperatureOfMainSequenceStars/
HR diagram http://www.howstuffworks.com/star4.htm
The colour of star depends on the temperature of its surface, but its absolute magnitude depends on the total output energy across the whole surface of the star. So a very big star can be relatively cool but still very bright, because there is a lot of cool surface giving out energy. Equally, although a star with a small volume and small surface area may be hot and white, it cannot be very bright because there is a limit to how much energy can escape across its surface each second without blowing the star apart. But on the main sequence all the stars are more or less the same size (they are all dwarf stars), even though they have different masses. This is key to using the diagram to understand stellar evolution. http://en.wikipedia.org/wiki/Hertzsprung%E2%80%93Russell_diagram
HR diagram – star formation Star formation Stars form when cool, relatively dense clouds of gas and dust in space shrink in upon themselves as a result of gravitational collapse. This mainly happens in giant molecular clouds, where the density is about 1 billion or 10 billion atoms per cubic metre. It is actually very difficult to make a cloud like this collapse. It is held up by pressure resulting from the heating of the gas by radiation from nearby stars, by magnetic field and by the centrifugal effect of any rotation. In a disc galaxy like our own Galaxy, star formation is triggered when clouds of gas are squeezed in the spiral density wave. Clouds may also collapse when they feel the blast from a supernova explosion. Once the cloud starts to collapse, it breaks up into fragments in accordance with the Jeans criterion. Their continuing collapse makes the fragments warm up, as gravitational energy is converted into heat. At first the infrared radiation produced can escape fairly easily, but as the fragments become more dense, they become opaque, holding in the radiation and causing the temperature inside the fragment to rise more dramatically. Each fragment of the original cloud is now a protostar, which continues to collapse until (after about 100,000 years for a star with the same mass as the Sun) a hot core, still gaining its energy from gravitational collapse, forms. Gradual collapse then continues in accordance with the Kelvin-Helmholtz timescale. At this stage, the protostar may be surrounded by a disc of material (especially if it is an isolated star, not in a binary system) from which planets can form. When a temperature at the heart of the protostar rises above about 10 million Kelvin, nuclear fusion reactions begin in its interior, and it settles down as a stable main sequence star. It takes a star like the Sun about 50 million years to reach main sequence; more massive stars get there more quickly, lighter stars more slowly.
HR diagram – star formation Jeans criterion A parameter which determines the size of regions in a cloud of gas with a certain temperature and density that are liable to gravitational collapse. The Jeans' criterion is only an approximate guide, but it predicts that, for example, the size of the objects formed by gravitational collapse at the time of the decoupling era in the early Universe would have been about that a globular cluster. Kelvin-Helmholtz timescale The length of time for which a star like the Sun could continue to radiate energy simply by contracting slowly under its own weight - about 20-30 million years. Decoupling era The time, about 380 000 years after Big Beng, when electrons and nuclei of hydrogen nad helium combined to form neutral atoms. In detail - wait for cosmology, last part of semestr.
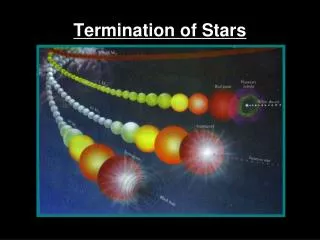
HR diagram • The position of a star on the main sequence depends only on its mass. • A small star does not have to burn its hydrogen very quickly in order to generate enough heat to hold it up against the inward tug of gravity, so it sits at the cool end of the main sequence, • amassive star has to burn a lot of fuel every second to prevent itself from collapsing under its own weight, so it sits high up on the main sequence. • One result of this is that the more massive stars at the top end of the main sequence burn out more quickly than the cooler stars lower down the main sequence. As a star uses up its hydrogen fuel, it becomes slightly brighter and cooler, but still sits essentially on the main sequence. When all of the hydrogen at the centre of the star is used up, the core of the star shrinks, while the outer layers of the stars expand as it becomes red giant. For a star like Sun, it takes about 10 billion years of main sequence life to use up the hydrogen fuel in its core. For an M star, with mass less than about one-tenth of the mass of the sun, it would take hundreds of billion years. But for a star with five times as much mass as our Sun, it will take only 70 million years before the star has to become a red giant. The most massive stars on the main sequence are about 50 times as massive as the Sun an perhaps 20 times its diameter.
HR diagram A red giant still produces a lot of energy, but this energy is now escaping from a much larger surface area, because the outer layers of the star have swollen. So the amount of energy crossing each square meter of the surface is less, and this is what determines the colour of the star. On the H-R diagram, as star ages it leaves the main sequence and shifts to the right, where it lies in a band known as the red giant branch. Some stars end up in a short strip to the left of the red giant branch (but still to the right of the line of the main sequence), known as the horizontal branch; these are stars that have lost mass during their time as red giants. Many of them pass through a phase of activity as RR-Lyrae or Cepheid variables. Eventually, perhaps after losing mass in a stellar explosion such as a nova or supernova, the ageing star (if it has not become neutron star or a black hole) runs out of fuel entirely and shrinks inward upon itself. Although the star is now cooling, because it has shrunk the escaping energy is passing through smaller surface area, so the energy crossing each square metre increases, and the star becomes a hot but faint white dwarf in the bottom left H-R diagram, before it fades away entirely into a stellar cinder. Of course all of this takes far longer than any human timescale, and nobody has seen a star literally moving around H-R diagram as it evolves. Astronomers have discovered the nature of stars in different parts of the diagram by studies of many stars at different stages in their life cycle, just as you could work out the life cycle of a tree by studying many trees at different stages in their life cycles in a wood over the course of a single year, rather then by watching a single tree for decades to see how it grew and aged. For stars, the observations are compared with computer models of how stars evolve, and used to refine those models. Interactive animation of star evolution i H-R diagram http://sunshine.chpc.utah.edu/labs/star_life/hr_interactive.html
HR diagram – stellar evolution When stars with different mass but the same age as each other are plotted in a H-R diagram, the exact pattern that is produced depends on their age. This shows up clearly when the stars of a globular cluster are plotted in this way, because all the stars in such a cluster did form together from the collapse of a single large cloud of gas. The brightest stars at the top left of the main sequence (the ones with most mass) burn their fuel first, because they need so much energy each second to stave off the eventual gravitational collapse. So they are the first to leave the main sequence and move across to the red giant branch. http://www.stellar-database.com/evolution.html http://astronomia.zcu.cz/hvezdy/diagram/26-simulator-hr-diagramu-java-applet
Model of polythropic star Equilibrium: dFp dFG dr r R From numerical calculations: ρ p r 0 R
Stelar luminosity Intensity of radiation: (from black body radiation law) Power: Stellar Luminostity: http://demonstrations.wolfram.com/StellarLuminosity/ Blackbody spectrum: http://demonstrations.wolfram.com/BlackbodySpectrum/ http://demonstrations.wolfram.com/BlackbodyRadiation/
HR diagram – stellar evolution If we could watch the same globular cluster for million years, plotting a new H-R diagram for the same stars in the cluster every 100 years or so, the main sequence would seem to shrink away from the top as the cluster aged, rather like a candle gradually burning down. Instead of a complete diagonal main sequence with a scattering of red giants on the branch to the right, the diagonal band at any time would only come up part of the way from the bottom right of the diagram, before turning off to the right. The exact point at which this turn-off occurs depends on the age of the cluster, and these turn-off ages ofglobular clusters (determined, once again, from a comparison between observations of many real stars andthe predictions of the computer HR diagrams for two open clusters, M67 and NGC 188, showing the main sequence turn-off at different ages models) provide one of the best indications of the ages of some of the oldest stars in our Galaxy. http://en.wikipedia.org/wiki/File:Open_cluster_HR_diagram_ages.gif
HR diagram – stellar evolution The H-R diagram can also be used in determining the distances to cluster of stars, because the positions of the stars in the main sequence is related to their absolute magnitude. The further away a cluster is from us, the fainter the light from its stars will be, and the lower down the H-R diagram its main sequence will seem to lie. This enables astronomers to set the distance to a cluster by choosing the value which adjust the apparent magnitudes of the stars by the right amount to make them match the standard main sequence. The open claster M67 http://apod.nasa.gov/apod/ap070809.html
Red giant Red giant: Name used by astronomers to describe M and K stars (and same others) which have evolved off the main sequence and expanded to 10 or 100 times the diameter of the Sun. They have surface temperature similar to those of red dwarfs, but radiate more energy because they have larger surface areas. Red giants can have a wide range of masses, up to tens of solar masses. A red giant simulation, made on SGI/Cray Origin-2000 with 128 processors (David Porter at all., University of Minnesota). Red Giant Stars and the Death of the Sun: http://demonstrations.wolfram.com/RedGiantStarsAndTheDeathOfTheSun/ http://www.aldebaran.cz/bulletin/2005_10/RedGiant.mpeg
News (12.3.2014): • largest yellow hypergiant star ever discovered: • http://www.eso.org/public/news/eso1409/ • ESO’s Very Large Telescope Interferometer has discovered the largest yellow star — and one of the ten largest stars found so far. • Parameters: • Name: HR 5171 A • Diameter: 1 300×R⊙(12 AU) • Distance: 12 000 Ly • Mass: not exceeding 20–25 m⊙ • Visual magnitude: 6.1 − 7.3 • Surface temperature: 5000 K • Dynamic systém: Binary systém • Branch in HR diagram: 0, yellow supergiant Discoverer: Olivier Chesneau (Observatoire de la Côte d’Azur, Nice, France) “The new observations also showed that this star has a very close binary partner, which was a real surprise,” says Chesneau. “The two stars are so close that they touch and the whole system resembles a gigantic peanut.” / Method of discovering: Interferometric, combine the light collected from multiple individual telescopes, effectively creating a giant telescopeup to 140 metres in size.
HR 5171 Picture: ESO (artistic impression), see also animation here: http://io9.com/this-is-the-largest-yellow-hypergiant-star-ever-discove-1542279399
Fact about yellow supergiants: • Yellow hypergiants are extremely rare, only several in the Milky Way, the best example being Rho Cassiopeiae. They're among the biggest and brightest stars in the cosmos, and are at a stage in their lives when they're highly unstable and rapidly changing. This instability causes the star to expel material outwards, which forms a large extended atmosphere around the star. • Parameters: • Absolute magnitude: around -9 • Temperature: 4 000 — 8 000 K http://en.wikipedia.org/wiki/Yellow_hypergiant
Nova Nova: The explosive outburst of a faint star to become, temporarily, a brightly visible object, or 'new' star. In ancient times, the faint stars associated with novae were seldom visible to the naked eye, which is why they were thought to be completely new stars. But with photographic techniques much more sensitive than human eyes, modern astronomers discovered that there is often a faint star visible at the site of a nova in old photographs of that part of the sky. This has made it possible to study precursors of novae, as well as their aftermath, and to develop a good model of how they occur. Most (almost certainly, all) novae are outbursts associated with white dwarf stars in binary systems, where the companion is the red giant in a close orbit. They are associated with the accreation of material from the companion (via an accretion disc), which builds up in a layer on the surface of the white dwarf. The flow of matter on the white dwarf amounts to about 1 billionth of the mass of the Sun each year. When enough of this layer has built up, the pressure at its base causes an explosive outburst of nuclear fusion reactions, blasting the material out into space and causing the star to flare up brightly. The process then repeats - many novae have been seen to flare up repeatedly (such as the star T Coronae Borealis, in 1866 and 1946), and the rest are thought to be repeaters with timescales too long to have been monitored yet by human observers. During a nova, the star brightness by about 10 magnitudes, (increasing its brightness 100,000 times in a few days, then fading over a few month) and its surface temperature rises to about 100 million Kelvin. The material ejected in each outburst amounts to only roughly one-tent-thousandth of the mass of the Sun, but this is an important source of heavy elements which enriches the interstellar medium - there are about 25 novae each year in an ordinary disc galaxy. The energy released in a nova is, however, only 1 millionth of that released in a supernova.
Nova Recurrent nova RS Ophiuci, since 1898 four outbursts, last 1985, naked eye visible, before od the 11th mag. http://apod.nasa.gov/apod/ap060224.html
Nova Nova Velorum 1999, with magnitude about 3 was visible to the unaided eye in southern skies. Nova Cygni 1992, gas envelope photographed in 1994 by HST. http://apod.nasa.gov/apod/ap990524.html http://apod.nasa.gov/apod/ap951227.html
Nova Multi-band photometry of Nova Cygni 1975, photometric observation from September 2 to November 9, 1975. Maximum brightness of m = 1.6. I … λ = 1.00 μm J … λ = 1.25 μm H … λ = 1.65 μm K … λ = 2.25 μm L … λ = 3.50 μm http://articles.adsabs.harvard.edu//full/1976PASJ...28..163K/0000167.000.html
Supernova - overview A supernova is the explosive death of a star in an event so violent that for a brief period that single star shines as brightly as a whole galaxy of more than 100 billion ordinary stars like the Sun. This is a relatively rare event. Most stars end their lives in much quieter fashion, and only a few supernovae occur in a galaxy like the Milky Way every century. But such events are of key importance in the evolution of a galaxy and for the existence of life forms like ourselves, because supernovae both manufacture all the elements heavier than iron and scatter these and other heavy elements through space when they explode. A great deal of the material in your body consists of atoms that have been processed inside stars which have then exploded as supernovae, spreading the elements into the interstellar matter from which new generation of stars, planets and people can form. We are literally made of stardust. All supernovae generate the enormous amounts of energy involved in these explosion s in essentially the same way, when the core of a star suddenly collapses all the way down to the size of a neutron star (or possibly, in some cases, into a black hole); there are, though, two different ways in which this collapse can be trigged, and these produce supernovae with two somewhat different types of appearance (there are also more subtle differences between individual supernovae, since no two stars are identical, but these are not as important as the main distinction). The two kinds of supernova, Type I and Type II, were originally distinguished on the basis of spectroscopy - the spectra of Type II supernovae shows features, caused by the presence of hydrogen, which are absent from the spectra of Type I supernovae. Continuing studies of supernova spectra and comparison with computer models can now explain this in terms of the way in which the two types of supernova are formed.
Supernova – Type I Type I supernovae occur in both elliptical galaxies and disc galaxies, and show no preference for being located in spiral arms. They are formed from the remnants of old, relatively low-mass Population II stars, and occur in binary systems where one star has evolved to the stage where it has become a white dwarf, and is gaining materiel form its companion by accretion. As the mass of the white dwarf increases, it eventually rises above the Chandrasekhar limit for a stable white dwarf (about 1.44 solar masses), and the star collapses under its own weight, releasing gravitational energy in the form of heat and triggering a wave of nuclear reactions that produce a flood of neutrinos. Type I supernovae are divided into other sub-categories, the main distinction being between Type Ia events, which show strong features due to silicon in their spectra, and Type Ib, which do not. It is thought that a Type Ia supernova produces the complete disruption of the collapsing white dwarf, which is blown apart by the energy released, spewing out a cloud material containing about the same mass as the Sun to forms an expanding shell (a supernova remnant), moving outward at tens of thousands of kilometres per second. All Type Ia supernovae seem to have much the same luminosity (corresponding to a peak absolute magnitude of -19), which makes them useful 'standard candles' that can be used to estimate distances to nearby galaxies.
Supernova – Type Ib Type Ib supernovae, which are more common than Ia, are triggered in much the same way, but are thought to involve white dwarfs left behind by relatively massive stars that have lost their outer layers in a strong stellar wind. The key difference with Type I is that a Type Ib supernova does leave behind a remnant in the form of neutron star or a black hole. In either case, though, the binary system is likely to be disrupted by the explosion, leaving the companion to the original white dwarf hurtling through space as a so-called 'runaway star'. In one interesting example, three runaway stars known as 53 Arietis, AE Aurigae and Mu Columbae seem to have been shot out from a single point in the constellation Orion, and are almost certainly left over from a supernova explosion that occurred in what was then a quadruple star system about 3 million years ago. AE Aurigae and the Flaming Star Nebula→ http://apod.nasa.gov/apod/ap110311.html
Supernova – Type II Type II supernovae may also occur in binary systems (after all, most stars are binaries), or in isolated stars. They are produced by explosions of young, massive Population I stars, rich in heavy elements, and occur mainly in the spiral arms of disc galaxies. They involve stars which still contain at least eight times as much mass as the Sun when they have exhausted all of their nuclear fuel. They are so big that even the ejection of material in a stellar wind cannot reduce their remaining mass below the Chandrasekhar limit, and even without the benefit of accreation their cores must collapse. Type II supernovae show more individual variety than Type Ia (Type Ib are more like type II) and are slightly less bright - they reach absolute magnitudes of around -17- but their behaviour is reasonably well understood, and most of the details of the following description have been confirmed by studies of Supernova 1987A (although, as it happens, that supernova was not entirely typical because the precursor star seems to have lost some of its atmosphere before the final collapse occurred).
Supernova – theory The key theoretical insight dates back to 1934, less than two years after the discovery of the neutron, when Walter Baade and Fritz Zwicky suggested that 'a supernova represents the transition of an ordinary star into neutron star'. But this idea began to be fully accepted only in the 1960s, when pulsars are identified as neutron stars and the Crab pulsar was found at the sight of supernova explosion that had been observed from Earth in AD 1054. Since then, different researches have developed slightly different models of how a supernova works, but the essential features are the same. The outline given here is based on calculations carried out by Stan Woosley and his colleagues at the University of California, Santa Cruz, and describes the death throes of a star like the one that became Supernova 1987A. The star was born about 11 million years ago, and initially contained about eighteen times as much mass as our Sun, so it had to burn its nuclear fuel furiously fast in order to hold itself up against the tug of gravity. As a result, it shone 40,000 times brighter than the Sun, and in only 10 million years it had converted all of the hydrogen in its core into helium. As the inner part of the star shrank and got hotter, so that helium burning began, the outer parts of the star swelled, making it into a supergiant. But helium burning could only sustain the star for about another million years. Once its core supply of helium fuel was exhausted, the star ran through other possibilities at a faster rate. For 12,000 years it held itself up by converting carbon into a mixture of neon, magnesium and oxygen; for 12 years neon burning did the trick; oxygen burning held the star up for just 4 years; and in a last desperate measure, fusion reaction involving silicon stabilized the star for about a week. And then, things began to get interesting.
Supernova Silicon burning is the end of the line even for a massive star, because the mixture of nuclei it produces (such as cobalt, iron and nickel) are among the most stable it is possible to form. To make heavier elements requires an input of energy. Just before the supernova exploded, all of the standard nuclear reactions leading up to the production of these iron-group elements were going on in shells around the core (with the s-process also at work). But as all the silicon in the core was converted into iron-group elements, the core collapsed, in a few tenths of a second, from about the size of the Sun into a lump only tens kilometres across. During this initial collapse, gravitational energy was converted into heat, producing a flood of energetic photons which ripped the heavy nuclei in the core apart, undoing the work of 11 million years of nuclear fusion. This 'photo-disintegration' of the iron nuclei was first suggested by Willy Fowler and Fred Hoyle in the 1960s. As the nuclei broke apart into smaller nuclei and even individual protons and neutron, electrons were squeezed into nuclei and even individual protons and neutrons, electrons were squeezed into nuclei and into individual protons, reversing beta decay. Gravity provided the energy for all this. All that was left was a ball of neutron material, essentially a single 'atomic nucleus', perhaps a couple of hundred kilometres across and containing about one and half times as much mass as the Sun. The squeeze caused by this collapse was so intense that at this point the centre of the neutron ball was compressed to densities even greater than those in a nucleus, and it rebounded, sending a shock wave out into the ball of neutron stuff and into the star beyond. Material from the outer layers of the star (still at least fifteen times as much mass as there is in the Sun!), which had had the floor pulled from under it when the core collapsed, was by now falling inward at roughly a quarter of the speed of light. But when the shock wave met this infalling material, it turned the infall inside out, creating an outward-moving shock front that blew the star apart - but not before a flood of neutrons emitted during all this activity had caused a considerable production of very heavy elements through the r-process.
Supernova – shock wave, neutrinos The shock wave was followed, but soon overtaken, by a blast of neutrinos from the core, produced as it shrank, in a second and final stage of collapse, all the way down to become a neutron star just 20 km across. This leisurely process took several tens of second (not tenths of second) to complete. By that time, the outgoing shock wave was trying to shove 15 solar masses of material out of the way, and had begun to stall. But as the shock stalled, the density of material in the shock front became so great that even some of the neutrinos (a few per cent of the total), overtaking the shock at the speed of light, were absorbed in it, dumping enough energy into the shock that it was able to start moving outward again and complete its job of blowing the outer layers of the star away. The rest of the neutrinos, carrying a couple of hundred times the energy that the supernova eventually radiated as visible light, went right through the outer layers of the star and on across the Universe; in the case of SN 1987A, just a handful of them were eventually detected on Earth. The shock wave was followed, but soon overtaken, by a blast of neutrinos from the core, produced as it shrank, in a second and final stage of collapse, all the way down to become a neutron star just 20 km across. This leisurely process took several tens of seconds (not tenths of a second) to complete. By that time, the outgoing shock wave was trying to shove 15 solar masses of material out of the way, and had begun to stall. But as the shock stalled, the density of material in the shock front became so great that even some of the neutrinos (a few per cent of the total), overtaking the shock at the speed of light, were absorbed in it, dumping enough energy into the shock that it was able to start moving outward again and complete its job of blowing the outer layers of the star away. The rest of the neutrinos, carrying couple of hundred times the energy that the supernova eventually radiated as visible light, went right through the outer layers of the star and on across the Universe; in the case of 1987A, just a handful of them were eventually detected form Earth.
Supernova remnants http://apod.nasa.gov/apod/ap110305.html
Supernova remnants http://apod.nasa.gov/apod/ap110212.html
Proton-proton reaction Proton-proton reaction (also called the p-p chain): The series of nuclear fusion reactions that generate energy inside a star like the Sun. The modern understanding of this process depends upon a combination of measurements (using particle accelerators here on Earth) of the rates at which various fusion reactions occur (their so-called cross-sections) and models of conditions inside the Sun, based on observations of the Sun's luminosity, size and mass. The proton-proton chain was first proposed as the source of solar energy by Hans Bethe and his colleague Charles Critchfield in 1938, but it was not established as the best model until the 1950s, partly because in the 1930s and 1940s it was not fully appreciated that more than 95 per cent of the Sun is simply hydrogen and helium. The proton-proton reactions is the main source of energy in stars on the main sequence that have roughly the same mass as the Sun, or less mass. More massive main sequence stars get their energy primarily from the carbon cycle.
Proton-proton reaction The p-p chain begins when two protons (hydrogen nuclei) get close enough to fuse as a result of the tunnel effect. They form a deuteron (a nucleus of deuterium), with one of the protons spitting out of neutrino and a positron in the process, to become a neutron. Another proton can then tunnel into the deuteron, making a nucleus of helium-3, containing two protons and one neutron. Finally, when two nuclei of helium-3, containing two protons and one neutrons. Finally, when two nuclei of helium-3 collide they form one nucleus of helium-4 (two protons plus two neutrons), ejecting the two extra protons.
Carbon cycle Carbon cycle (also called the CNO cycle): The process of nuclear fusion reactions that provides the energy source inside hot, massive stars, especially those with a spectral classification of O, B or A. At the heart of such stars, the temperature is above 20 million Kelvin. Most of the material there is in the form of nuclei of hydrogen (protons), but there are traces of other nuclei, including those of carbon. The CNO cycle was worked out in 1938 by Hans Bethe and independently by Carl von Weizsäcker (1912-).
Carbon cycle The CNO cycle works like this: First a proton penetrates a nucleus containing six protons and six neutrons (a nucleus of carbon-12), through the tunnel effect. This creates an unstable nucleus of nitrogen-13, which emits a positron and a neutrino, converting itself into a nucleus of carbon-13. If a second proton now tunnels into this nucleus, it becomes nitrogen-14, and the addition of a third proton converts it into oxygen-15, which is unstable and spits out a positron and a neutrino as it transmutes into nitrogen-15. But now, if yet another proton tunnels into the nucleus, it ejects an alpha particle (two protons and two neutrons bound together to form a nucleus of helium-4). This leaves behind a nucleus of carbon-12, identical to the one that started the cycle. The net effect is that four protons have been converted into one helium nucleus, a couple of positrons and two neutrinos. But the mass of a helium nucleus plus these other particles is less than the mass of four protons put together. The difference in mass has been converted into energy, in line with Einstein's equation E = mc^2, keeping the heart of the star hot. Just 0.7 per cent of the mass of each set of four protons is turned into energy every time a helium nucleus is made.http://demonstrations.wolfram.com/StellarNucleosynthesis/
Degenerate matter Matter at such high density that quantum effects dominate its behaviour, and in particular provide an outward pressure much grater than pressure appropriate to that density of material according to classical mechanics. Degenerate matter exists in old stars which have undergone gravitational collapse after they have exhausted all their nuclear fuel, and can no longer keep themselves hot inside by nuclear fusion processes. Under the extreme conditions of temperature and pressure inside a star, electrons are not held tightly to atomic nuclei to form atoms, but move freely among the nuclei in a form of matter known as plasma. As the dying star shrinks under its own weight, the electrons and nuclei are packed more and more tightly together, until quantum effects prevent the electrons from being squeezed any more. At that point, the star becomes a stable white dwarf, about the size of the Earth, supported by electron degeneracy pressure - provided it is light enough. If the star still has more mass than the Chandrasekhar limit (a little less than one and a half times the mass of our Sun), at this stage of its evolution, even pressure of the degenerate electrons cannot prevent further gravitational collapse. The electrons are forced to combine with protons to make neutrons. This allows further collapse, to the point where the same quantum processes that provide an electron degeneracy pressure now make the neutrons degenerate and prevent them coming any closer to one another; the entire star becomes a ball of neutrons a few kilometres across - a neutron star. But if the star has more than about three times as much mass as our Sun (the Oppenheimer-Volkoff limit) at this stage of its life, even neutron degeneracy cannot hold it up, and it collapses further to become a black hole, crushing the matter from which it was made out of existence. http://scienceworld.wolfram.com/physics/ChandrasekharLimit.html http://en.wikipedia.org/wiki/Chandrasekhar_limit
Degenerate matter Pauli exclusion principle: An expression of a law of nature which prevents any two electrons (or other fermions) from existing in exactly the same quantum state. The principle was formulated by Wolfgang Pauli in 1925, specifically to explain the arrangement of electrons in atoms. By then, it had been well established that successively heavier elements (starting with hydrogen, the lightest element) have their electrons arranged around the central nucleus. Helium has two electrons, each at the same distance from the nucleus. Lithium has three electrons, the first two at the same distance from the nucleus. Lithium has three electrons, the first two at the same distance from the nucleus. Lithium has three electrons, the first two at the same distance from the nucleus as the helium electrons (in the same "electron shell", in the jargon of quantum theory), with the third slightly further out from the nucleus. The first electron shell can contain only two electrons, the second up to eight (corresponding to neon, with ten electrons in all), and there are similar limitations for still heavier elements, with electron shells wrapped like onion skins around the nuclei. Pauli found that the number of electrons in each shell exactly matches the number of different combinations of quantum properties allowed for an electron in that shell. For example, in the innermost shell each electron has the same energy, but the two electrons spin in opposite senses, so they are (in principle) distinguishable from one another. The quantum rules are more complicated for outer shells, but in each case every electron has a unique set of quantum "labels".