Download
1 / 9
90 likes | 173 Views
DNA Engineering - Week 3. APh162 Winter 2007. Small et al. (1992, 1996). Elowitz et al. (2000). Setty et al. (2003). Quantitative Gene Expression. Gene expression: Process by which DNA is converted into the structures and functions of the cell

E N D
DNA Engineering - Week 3 APh162 Winter 2007
Small et al. (1992, 1996) Elowitz et al. (2000) Setty et al. (2003) Quantitative Gene Expression • Gene expression: Process by which DNA is converted into the structures and functions of the cell • We can now talk about gene expression quantitatively • We have quantitative data, we need quantitative models! How much? When? Where? Slide courtesy of H. Garcia
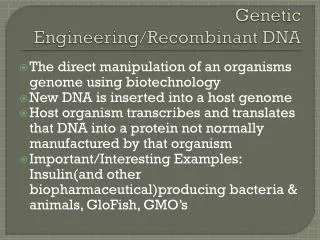
Key Idea of Gene Expression – The lac Operon • Key idea: Proteins are synthesized only when needed • Two food sources for E.coli: Glucose and lactose. • Lactose requires the synthesis of 3 proteins in order to be metabolized! • When glucose is absent: Expressed lacZ => -galactosidase => metabolize lactose
The Lac Operon [Glucose] 1/[cAMP] Glucose + Lactose + P O CAP lacZ Low (leaky) expression => 5’ 3’ Activator protein RNA Pol cAMP Glucose – Lactose + High expression lacZ => 5’ 3’ Lac rep Glucose + Lactose - No expression P CAP => X 5’ 3’ Activator protein Glucose – Lactose - No expression Lac rep cAMP => P X 5’ 3’
Detection of Gene Expression • How can we detect the high level of gene expression of the lacZ gene? • Plate the cells in plates that • Do not have glucose (don’t want the repression) • IPTG (like lactose, will pull of the lac repressor from the operator => induces the expression) • Substitute lactose with X-gal (turns blue when cleaved!) Colonies of cells with the expressed lacZ in their plasmids turn blue! IPTG + X-gal
Gene Expression Quantitatively • Look at gene expression 2 different ways • YFP fluorescence • lacZ expression At different levels of IPTG • Does the amount of expression depend on the reporter? Slide courtesy of H. Garcia
pZS25-YFP KAN KAN pZE21-LacZ YFP Extract LacZ Cut “Vector” “Insert” KAN YFP PCR, purify LacZ LacZ Purify Ligation Trim, purify LacZ LacZ YFP KAN KAN Killer cut, purify LacZ YFP Transform and plate Extract and send for sequencing LB + Kanamycin (IPTG, X-Gal)
Gel Electrophoresis Ladders • Distance traveled depends on: • Mass • Shape • Electric charge Graph of the distance traveled vs. mass?