Download
1 / 9
90 likes | 168 Views
Objectives. Identify solutions of inequalities with one variable. Write and graph inequalities with one variable. <. >. ≥. ≤. ≠. A < B. A > B. A ≤ B. A ≥ B. A ≠ B. A is greater than or equal to B. A is less than or equal to B. A is less than B. A is greater

E N D
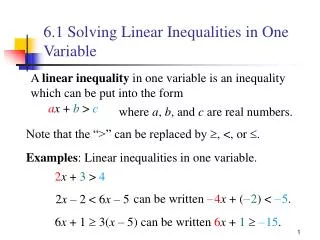
Objectives Identify solutions of inequalities with one variable. Write and graph inequalities with one variable.
< > ≥ ≤ ≠ A<B A >B A ≤ B A ≥B A ≠ B A is greater than or equal to B. A is less than or equal toB. Ais less thanB. A is greater thanB. A is not equal toB. An inequality is a statement that two quantities are not equal. The quantities are compared by using the following signs: A solution of an inequality is any value that makes the inequality true.
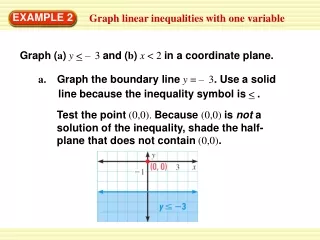
0 2 3 3 – t < 5(–1 + 3) 1 t < 5(2) t < 10 0 –8 –6 –4 –2 2 4 6 8 10 12 Example 1: Graph each inequality. A. m ≥ B. t < 5(–1 + 3)
–3 –4 –2 –1 1 2 3 4 5 6 0 –3 –4 –2 –1 1 2 3 4 5 6 0 Example 2 Graph each inequality. a. c > 2.5 2.5 b. 22 – 4 ≥ w 22 – 4 ≥ w 4 – 4 ≥ w 0 ≥ w
Example 3: Writing an Inequality from a Graph Write the inequality shown by each graph. x < 2 x ≥ –0.5
Reading Math “No more than” means “less than or equal to.” “At least” means “greater than or equal to”.
An employee earns at least $8.50 w ≥ 8.50 8.5 −2 0 2 4 6 8 10 12 14 16 18 Check It Out! Example 4 A store’s employees earn at least $8.50 per hour. Define a variable and write an inequality for the amount the employees may earn per hour. Graph the solutions. Define a variable means write a let statement Let w represent an employee’s wages. w ≥ 8.5
–4.75 –5 –4.5 Lesson Quiz: Part I 1. Describe the solutions of 7 < x + 4. all real numbers greater than 3 2. Graph h ≥ –4.75 Write the inequality shown by each graph. x ≥ 3 3. x < –5.5 4.