Download
1 / 1
10 likes | 171 Views
Estimation of Water Uptake using the Stem-Heat Balance Technique for 2- and 4-year old Citrus 1 Davie Kadyampakeni, 1 Kelly T. Morgan, 2 Arnold W. Schumann, 3 Peter Nkedi-Kizza 1 Southwest Florida Research and Education Center, 2686 SR 29N, Immokalee, FL 34142

E N D
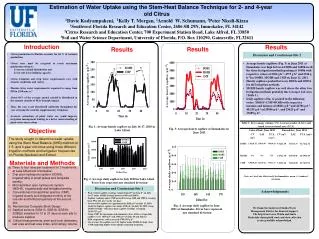
Estimation of Water Uptake using the Stem-Heat Balance Technique for 2- and 4-year old Citrus 1Davie Kadyampakeni, 1Kelly T. Morgan, 2Arnold W. Schumann, 3Peter Nkedi-Kizza 1Southwest Florida Research and Education Center, 2686 SR 29N, Immokalee, FL 34142 2Citrus Research and Education Center, 700 Experiment Station Road, Lake Alfred, FL 33850 3Soil and Water Science Department, University of Florida, P.O. Box 110290, Gainesville, FL32611 Introduction Results Results Results Discussion and Conclusions-Site 2 • Citrus production in Florida accounts for 68 % of national production. • Citrus trees must be irrigated to reach maximum production owing to: • 1) uneven rainfall distribution and • 2) low soil water-holding capacity. • Citrus irrigation and crop water requirements vary with climatic conditions and variety • Florida citrus water requirement is reported to range from 820 to 1280 mm yr-1 • About 60% of the average annual rainfall is distributed in the summer months of May through August . • Thus, the rain is not distributed uniformly throughout the year stressing the need for supplementary irrigation. • Accurate estimation of plant water use could improve irrigation management leading to a better understanding of plant-water-interactions . • Average hourly sapflows (Fig. 3) in June 2011 at Immokalee was high between 1000h and 1600h in all the three fertigation methods peaking at 1400h with respective values of 2026 g h-1, 4775 g h-1 and 2516 g h-1 for DOHS, MOHS and CMP on June 12, 2011. • Hourly sapflows peaked between 1000 h and 2000 h for all fertigation methods. • MOHS hourly sapflow was well above the other two fertigation methods probably due to larger leaf area (Table 1). • Daily sapflows (Fig. 4) peaked in the following order: MOHS>CMP≈DOHS with respective maxima and minima of 60821 g d-1 and 42786 g d-1, 40,335 g d-1 ad 20906 g d-1, and 29625 g d-1and 17689 g d-1. Fig. 1: Average hourly sapflow on July 16-17, 2010 in Lake Alfred Objective Fig. 3: Average hourly sapflow at Immokalee in June 2011 The study sought to determine water uptake using the Stem Heat Balance (SHB) method on 1.5- and 4-year old citrus using three different irrigation methods and fertigation frequencies on Florida Spodosol and Entisol. Materials and Methods • Three to four trees per treatment for 3 treatments • at Lake Alfred and Immokalee: • Drip open hydroponic system (DOHS), • irrigated daily in small pulses and fertigated • weekly; • Microsprinkler open hydroponic system • (MOHS), irrigated daily and fertigated weekly; • Conventional microsprinkler practice (CMP), • irrigated weekly and fertigated monthly at the • one site and fertilized quarterly at the second • site. • b) Randomized Complete Block Design • c) Sapflow sensors (SGA13, SGB16, SGB19, • SGB25) installed for 10 to 21 days at each site to • measure sapflow • d) Critical measurements: stem and trunk diameters, • leaf area and leaf area index, and canopy volume Note: n=3 for Lake Alfred and 4 for Immokalee, mean ± 1 standard deviation Fig. 2. Average daily sapflow in July 2010 in Lake Afred. Error bars represent one standard deviation Discussion and Conclusions-Site 1 Acknowledgements • Peak hourly sapflow readings ranged from 119 to 262 g h-1 on July • 16-17 under DOHS-Swingle between 1000 and 2000 h. • Sapflow readings under CMP peaked between 1100 and 1900 h, ranging • from 99 to 213 g h-1 on the two days. • Lowest daily sapflow was approximately 2050 g d-1 on July 12, 2010 • while the highest sapflow was about 4740 g d-1 on July 18, 2010 using • DOHS-Swingle with mean daily sapflow readings averaging • 3958±737 g d-1. • Using CMP, the maximum and minimum values of the average daily • sapflows were 3830 g d-1 and 1705 g d-1 on July 10 and July 25, • 2010, respectively, with a mean of 2749±585 g d-1. • On average, the sapflow was 44% higher under DOHS-Swingle than • CMP suggesting higher water uptake using drip irrigation. We thank the Southwest Florida Water Management District for financial support. The help from Laura Waldo and Smita Barkataky during field work and data collection is also gratefully acknowledged. Fig. 4. Average daily sapflow in June 2011 at Immokalee. Error bars represent one standard deviation