Download
1 / 54
540 likes | 689 Views
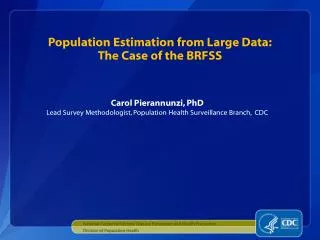
Population Estimation from Large Data: The Case of the BRFSS. Carol Pierannunzi, PhD Lead Survey Methodologist, Population Health Surveillance Branch, CDC. National Center for Chronic Disease Prevention and Health Promotion. Division of Population Health.

E N D
Population Estimation from Large Data:The Case of the BRFSS Carol Pierannunzi, PhD Lead Survey Methodologist, Population Health Surveillance Branch, CDC National Center for Chronic Disease Prevention and Health Promotion Division of Population Health
Purpose of Today’s Discussion:Population Estimation Using BRFSS as a Case • Explain how large data sets can be used to generalize to a population • Explain the BRFSS as part of public health surveillance • Examine sampling for population estimation • Illustrate problems in data collection • Examine how probability of selection impacts weighting(design weighting) • Examine weighting (post stratification, iterative proportion fitting/raking) • Discuss impact of complex sampling in data analyses • Take a look at the future of population estimation through new methods
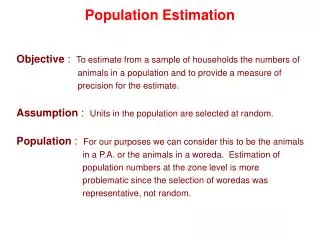
Population Estimation • Census • Intercensal estimation • Voting studies • Consumer confidence studies • Marketing studies • Social and political attitudes and values • Needs assessments, gap analyses • and PUBLIC HEALTH surveillance
Public Health Surveillance The U.S. is highly variable in terms of • Geography • Population demographics • Distribution of disease burden and risk factors • Organization of state and local public health infrastructure Public health programs are primarily designed and delivered by state and local jurisdictions, which address their unique needs within their unique contexts. Public health surveillance provides data for needs assessments and program evaluation, contributing to the effectiveness and efficiency of public health programs.
What is the BRFSS? • BRFSS is a partnership between CDC and state health departments to produce data which benefit states, territories, localities and public health professionals. • BRFSS includes 57 state/territorial level telephone surveys on health status, health risk behaviors and chronic conditions. Most jurisdictions have collected data since the mid 1980s. • Collects data from approximately 450,000 persons each year. • It is the only source of public health behavior and risk factor data at state/local/territorial level for most states.
BRFSS Partnership Provides a Unique Dataset • State/territorial-level estimates and confidence intervals • Selected Metropolitan/Micropolitan Area Risk Trends (SMART) • Direct estimates and confidence intervals for cities and counties where sample size is sufficient • Over 200 MMSAs in 2012 • County-level indicators (7-year aggregation) which are used by: • Community Health Rankings • Community Health Status Indicators • Health Indicators Warehouse • MedMap • Public datasets which are subsets of data collected by states
BRFSS Has Four Components: • Core Survey Implemented with standardized protocols. Includes regular and rotating core sections--required of all states and territories • 2. Optional Survey Modules proposed by CDC Programs and other agencies (e.g., SAMHSA, Veteran’s Affairs) 3. State-Added Questions are developed by each state to meet their individual needs and issues--optional 4. Special Project Additions - proposed on as needed basis with dedicated funding (examples include Asthma call-back & H1N1)
BRFSS Core Survey • Immunization • HIV/AIDS • Diabetes • Asthma • Cardiovascular Disease • Alcohol consumption Exercise • Health Status • Health Care Access • Healthy Days • Disability • Tobacco Use • Sleep Exercise
BRFSS Rotating Core Questions • Odd Years • Fruits & vegetables • Hypertension awareness • Cholesterol awareness • Arthritis burden • Physical activity Even Years • Breast/Cervical cancer screening • Prostate screening • Colorectal cancer screening • Oral health • Falls • Seatbelt use • Drinking & driving
Optional Survey Modules • Adult asthma history • Anxiety and depression • Arthritis management • Cardiovascular health • Child immunization • Childhood asthma • Diabetes • General preparedness • Healthy days: symptoms • Home environment • Influenza • Indoor air quality • Intimate partner violence • Osteoporosis • Random child selection • Reactions to race • Secondhand smoke policy • Sexual violence • Smoking cessation • Visual impairment • Weight control • And more…
Detecting Emerging Issues Obesity Trends* Among U.S. AdultsBRFSS, 1990, 1999, 2008 1990 1999 2008 (*BMI 30, or about 30 lbs. overweight for 5’4” person) No Data <10% 10%–14% 15%–19% 20%–24% 25%–29% ≥30%
Steps in the BRFSS Data Production Process • Designing the sampling • Designing the questionnaire • Collecting data • Cleaning and processing data • Weighting datasets • Analyses with BRFSS using complex sampling
Sampling (1):Using telephone numbers as sample units Sample-to- population linkage problems (see Kalsbeek) Shared phones Persons with multiple phones Persons with no phone access (< 2%); see Waksberg-Mitofski method for adjustment
Sampling (2):Unweighted Prevalence by Frame-to-Population Linkage(after adjusting for demographic variables) *Prevalence estimates for ALL frame-to-population linkages, significantly different from one-to-one frame. σ² Indicates statistically significant increases in variance.
Sampling (3):Let’s make it more complicated • Substate geostrata • Public health districts • Congressional districts • Counties • Oversampling subpopulations • Splitting samples to obtain more information • Respondents could potentially be reached on more than one phone • Landline frame • Cell Phone frame • Difficult to estimate location based on phone number • Ported phone numbers • VOIP, security systems, OnStar: deterioration of confidence in “phone” numbers
Sample (4):How it finally comes out Sample approximately 8,000,000 numbers = 450,000 interviews Geostrata Cell phone sample Landline sample Sample of persons living in other states with state phone numbers
Sample (5):A few comments on sampling • Sample designs must take in account how the data will be analyzed • Corrections to population-to-frame linkages must be made • Calculate the probability of selection for each potential respondent and adjust (design weighting) • Sampling cannot account for lack of coverage • Surveys with only landline phone numbers • Persons without phones in all phone surveys • Samples can be purchased, but take care • Phone samples are deteriorating (especially landline samples)
Designing the Questionnaire (1) • Questions may be proposed by: • States • CDC programs (e.g., nutrition, chronic disease programs) • HHS • Other federal agencies ( VA, SAMHSA) • Questions are subjective things • Validation • Norming from large populations • Validating against “gold standard”/ other surveys • Test/retest reliability estimation • Cognitive testing • Focus groups • Field testing
Designing the Questionnaire (2) • Identical questions can be compared across surveys with different samples • Identical questions can be compared across time • Questions need periodic review • Example: eye dilation questions revised due to changes in medical technology • Length of the questionnaire • Too much jargon (e.g. diabetes v “sugar”)
Designing the Questionnaire (3):How questions affect data • Order of questions/ order of responses can change response • Most CATI software will randomize order of response sets • Language barriers can affect outcomes • Questions adopted from clinical use are not always appropriate for phone interview • Sensitive questions • Suicide • IPV • Does respondent know the answer • Too much recall is problematic • Behaviors are easier to measure than attitudes
Designing the Questionnaire (4):Sample questions 2.3 During the past 30 days, for about how many days did poor physical or mental health keep you from doing your usual activities, such as self-care, work, or recreation? (85-86) _ _ Number of days 8 8 None 7 7 Don’t know / Not sure 9 9 Refused Do you have any kind of health care coverage, including health insurance, prepaid plans such as HMOs, government plans such as Medicare, or Indian Health Service?(87) 1 Yes [If PPHF state go to Module 4, Question 1, else continue] 2 No 7 Don’t know / Not sure 9 Refused Column numbers Open ended question Skip pattern Closed ended question
Collecting Data (1):Let’s don’t bore you with the details • Specific guidelines often found in technical documentation of surveys (see www.cdc.gov/BRFSS) • Calling times • Training/supervising interviewers • Software applications for data entry • Screening respondents • Maintaining data quality • Computing response and cooperation rates • AAPOR, CASRO, ASA,AEA standards for data collection and reporting
Collecting Data (2):Missing data and statistical inference • Respondents can refuse questions • Income most refused question on most surveys • Sensitive questions • High levels of nonresponse may indicate that question is poor • Imputation of data needed for weighting (non- ignorable missing values(Andridge, R. R. and Little, R. J. A. (2010), A Review of Hot Deck Imputation for Survey Non-response. International Statistical Review, 78: 40–64. ) • Nearest neighbor • Hot deck imputation Mean/median value replacement • Predictive imputation methods • Imputation of other data (ignorable missing values)
Data Collection (3):Consequences of missing data • Reduce n in analyses • May result in collapsing categories or geographic areas • Bias weighting process • Bias estimates • Total nonresponse is measured by response rate • Some journals will not publish data from surveys where response rates are low • Low response rates are increasingly problematic • Check unweighted demographic characteristics against census data to determine whether there is a pattern of nonresponse. • Item nonresponse is refusal to answer a specific question
Cleaning and Processing Data (1):Basics • Out-of-range codes • Checking responses against each other • Zip code and county responses should match • Double checking column locations • Modules may mean lots of empty cells in the data layout • Producing calculated variables • Calculated variables are noted in the dataset by a leading underscore (e.g. _BMICAT4) • BMI • Binge drinker • Everyday smoker • Persons under 65 without health insurance
Cleaning and Processing Data (2):It’s not as easy as it looks • Automated processes do not eliminate data cleaning problems • Clean data continuously during collection period to avoid problems • Watch for data patterns which are possible, but not likely • Unusual number of persons aged 77, but not 78 or 76 • Watch for latency in response • Clumping of responses around multiples of 5 or 7 when asked how many times per month • When data are collected from a number of sources, there are likely to be response differences that must be standardized
Weighting (1):Overview • Weighting matches the respondents to the population using demographic characteristics which are KNOWN in the population and observed in the sampled respondents. • Generally weighting includes race, sex, age, by region. • BRFSS also uses Hispanic ethnicity, education, marital status, home ownership and phone ownership, but NOT income. • Each person interviewed is assigned a weight, which is the number of persons in the population represented by that single respondent
Weighting (2):Two part process • Design weights account for the probability of selection • Based on the number of phones and eligible respondents at each phone number dialed, as well as accounting for the probability of selection of each individual given the number of phone numbers in the sample • Post-stratification weights adjust the responses according to the race, age, marital status, home ownership category, education level, ethnicity and sex of each respondent and the corresponding proportions of persons who match their demographic characteristics in the population. • This requires that you know the proportions in the population
Weighting (3):Design and geostrata weighting • Takes into account the geographic region/strata of the sample. • Design weight uses number of adults in household and number of phones in household for landline sample. • BRFSS landline sample is drawn using low/high density strata within each of the geostrata (1-70+ per state) • Stratum weight (_STRWT) = NRECSTR (number of records in the strata)/ NRECSEL (number of records selected)
Weighting (4):Calculating the design weight • Design Weight = _STRWT* (1/NUMPHON2) * NUMADULT • NUMPHON2= number of phones within the household • NUMADULT = number of adults eligible for the survey within the household • Questions for the design weights are asked in screening questions and in demographic sections of the survey
Weighting (5):Calculating the post stratification weight • Only one weight per data unit • Combine design and post-stratification weights: Total Weight = Dweight * PSweight For BRFSS we use iterative proportional fitting (IPF, also known as raking) to get the post stratification weight.
Weighting (6):Old methods using traditional post stratification • Post Stratification was based on known demographics of the population • For BRFSS Post stratification included: ·Regions within states ·Race/ Ethnicity (in detailed categories) ·Gender ·Age (in 7 categories) • Post-stratification forces the sum of the weighted frequencies to equal the population estimates for the region or state by race, age ,and gender • Post stratification weights are applied to the responses, allowing for estimates of how groups of non-respondents would have answered survey questions
Weighting (7):Old methods of post-stratification • Post-stratification Adjustment Factor is calculated for each race/ethnicity, gender, and age group combination. • Requires knowledge of each subset of each factor at the geographic level of interest –otherwise categories must be collapsed • Requires a minimum number of persons in each cell—otherwise categories must be collapsed • All weighting variables were imposed on the process in a single step
Weighting (8): Weight trimming with old methods of post stratification • Sometimes post-stratification resulted in very small or disproportionately large weights within age/race/gender/region categories • Weight trimming or category collapsing would be done if categories were disproportionately large or too small (< 50 responses)
Weighting (9):Iterative Proportional Fitting Rather than adjusting weights to categories, IPF adjusts for each dimension separately in an iterative process. The process will continue up to 125 times, or until data converges to Census estimates.
Weighting (10):New Variables Introduced as Controls With IPF • Education • Marital status • Home ownership/renter • Telephone source (cell phone or landline) NOTE: It is not possible to get subcategories of other variables by phone ownership, so post stratification was no longer possible.
Weighting (11):Post stratification vs. iterative proportional fitting Operates with less computer time Allows for incorporation of new variables. Allows for incorporation of cell phone data. Seems to more accurately represent population data (reduces bias).
Weighting (12):Raking – Iteration 1 Should be │.025│ or less