Download
1 / 1
10 likes | 132 Views
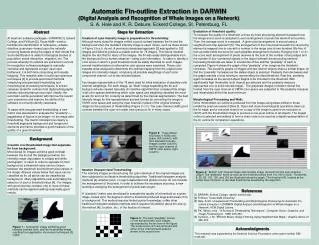
Automatic Fin-outline Extraction in DARWIN (Digital Analysis and Recognition of Whale Images on a Network). S. A. Hale and K. R. Debure, Eckerd College, St. Petersburg, FL. Abstract

E N D
Automatic Fin-outline Extraction in DARWIN(Digital Analysis and Recognition of Whale Images on a Network) S. A. Hale and K. R. Debure, Eckerd College, St. Petersburg, FL Abstract At least two software packages—DARWIN [1], Eckerd College, and FinScan [2], Texas A&M—exist to facilitate the identification of cetaceans—whales, dolphins, porpoises—based upon the naturally occurring features along the edges of their dorsal fins. Such identification is useful for biological studies of population, social interaction, migration, etc. The process whereby fin outlines are extracted in current fin-recognition software packages is manually intensive and represents a major user input bottleneck: it is both time consuming and visually fatiguing. This research aims to build upon previous techniques [3] to provide automated methods (employing unsupervised thresholding and morphological processing techniques) to extract cetacean dorsal fin outlines from digital photographs thereby reducing manual user input. Ideally, the automatic outline generation will improve the overall user experience and improve the ability of the software to correctly identify cetaceans. To assist with unsupervised thresholding, a new metric was developed to evaluate the "pixelarity"—jaggedness of figures in an image—of an image after thresholding. The metric indicates how cleanly a threshold segments background and foreground elements and hence provides a good measure of the quality of a given threshold. Steps for Extraction Creation of cyan intensity image in preparation for thresholding: Although many dorsal fin images exhibit a good contrast between the fin and the background when the standard intensity image is used, others, such as those shown in Figure 2 b,e,h, do not. A previously developed approach [3] was applied to 302 images and failed to produce a usable outline for 78 images. This failure resulted despite the fact that for many of the images, the fin was easily distinguishable from the background for a human observer—using color information. In order to identify a color space in which a good threshold could be easily identified for such images, several transformations to alternative color spaces were examined. These color systems were analyzed to determine the optimal mapping from the original color images into intensity images, comparing all possible weightings of each color component channel, out to two-decimal places. Ten images representative of the 78 were used for initial evaluation of possible color channel weightings. For each image, an “ideal” image separating the fin and background was created manually. An iterative algorithm then compared the image in all color spaces determining which color space and weighting classified the most pixels (fin and not fin) correctly as determined by the manual segmentation. The best intensity image for this representative set was formed by converting the image to CMYK color space and using the cyan channel in place of the original intensity image for the purposes of thresholding (Figure 2 c,f,i). The cyan channel yields good contrast between the cyan-rich water and cyan-poor fin in many cases. Evaluation of threshold quality: To evaluate the quality of a threshold, a three by three structuring element is passed over the image and a score is assigned to each arrangement of pixels the element encounters. Then, the average score is computed. A given pixel arrangement is scored using a neighborhood map approach [5]. The arrangement of the nine pixels beneath the structuring element is mapped one-to-one with a number in the range zero to two-hundred fifty-five. A look up table holds the score for each possible arrangement of pixels. Ranging from 1 to 21, the score each arrangement of pixels receives is the sum of the number of long edges and the number of four-connected objects in the region beneath the structuring element. Increasing thresholds are taken in increments of five and the “pixelarity” of each is computed. Figure 4 shows the graph of the “pixelarity” of an image as the threshold increases. The pixelarity graphs of images with two distinct objects share a similar shape. At first the “pixelarity” increases as the darker object is selected. Pixelarity then decreases and the graph reaches a local minimum, representing the ideal threshold. Past this, pixelarity again increases as the second object begins to be included in the threshold. With significantly high thresholds, both objects are selected and the pixelarity measure approaches one (a solid-colored image). The grayscale images of dolphin dorsal fins formed from the cyan channel in CMYK color-space are subjected to this pixelarity measure and thresholded at the first local minimum. Morphological Processing and Walk: Once thresholded, an outline is produced from the image using steps similar to those yielded by previous research [See 3]. Open and close morphological operations clean up the fin edge, and a one-pixel erosion on a copy of the image is used in an exclusive or (XOR) with the thresholded image to produce a one-pixel outline of all objects. The largest outline is selected and walked to form a chain code to be used as a digital representation of the fin outline for comparison operations. a b c Figure 2: Three dorsal fin photos in RGB color space (left column), with their standard intensity images (center column), and the cyan channel of CMYK color space (right column). d e f Background Creation of a thresholded image that separates fin from background: Most dorsal fin images exhibit a good contrast between the fin and the background when the intensity image (equivalent to a black and white photograph) is used. In order to separate fin from background, a threshold value can be chosen between the maximum and minimum pixel values in the image. All pixel values below that value can be classified as fin, all above can be classified as background. Many algorithms exist automating the selection of such a threshold value [4]. For images with good intensity contrast, one or more of these methods can be applied yielding reasonably good results. g h i Iterative Unsupervised Thresholding: The intensity images produced using the cyan channels of the original images are then subjected to an iterative thresholding algorithm. Traditional histogram analysis methods [4], whether point- or region-dependent and global or local, do not consider the arrangement of the pixels. In order to achieve the necessary accuracy, a new technique analyzing the arrangement of pixels was sought. A “pixelarity” metric was developed to evaluate the quality of a threshold on a given image, based upon the degree to which a threshold produced large solid areas of fin or background. This method requires limited a priori knowledge, unlike other traditional histogram analysis methods which required information about the size (p-tile method [4]), location, etc., of the feature of interest. Figure 4: Bottom Left: Original image and intensity image derived from the cyan channel. Graph: The “pixelarity” score (y-axis) as the threshold varies from 0 to 160 (x-axis). Thresholds 8, 25, 65, 102, 120, and 152 are illustrated along the graph. The threshold 65, located at the center local minimum, is the ideal threshold as selected by the algorithm. References [1] DARWIN. Eckerd College. darwin.eckerd.edu. [2] FinScan. Texas A&M University. [3] Hale, Scott. Unsupervised Thresholding and Morphological Processing for Automatic Fin-outline Extraction in DARWIN (Digital Analysis and Recognition of Whale Images on a Network). ACM Digital Library. [4] P.K. Sahoo, et al., “A Survey of Thresholding Techniques,” Computer Vision, Graphics, and Image Processing 41. 1988, 233-260. [5] Cychosz, J. M. “Efficient Binary Image Thinning Using Neighborhood Maps,” Graphic Gems, IV. 465-473. Figure 3 : The best “pixelarity” scores (1) are achieved with solid images represented by the first row of the figure. The worst scores (21) are achieved with either of the checkerboard patterns shown in the second row. Figure 1 : A dorsal fin image exhibiting good intensity contrast (left), and the thresholded image resulting from application of previous techniques [3] (right). Acknowledgments This research was supported by the National Science Foundation under grant number DBI-0445126.