MAPS
MAPS. A Very spatial Presentation . From this: 6 th Century BC. Ancient Babylonian clay tablets Depict the earth as a flat circular disk Earliest direct evidence of mapping comes from the middle east. To This: Middle Ages. Arab Maps advanced earlier greek practices

MAPS
E N D
Presentation Transcript
MAPS A Very spatial Presentation
From this: 6th Century BC • Ancient Babylonian clay tablets • Depict the earth as a flat circular disk • Earliest direct evidence of mapping comes from the middle east
To This: Middle Ages • Arab Maps advanced earlier greek practices • Al-Idris’s Famous world map • European maps were more ecclesiastic than cartographic • Dominated by the church
To This: 20th Century • Aerial Photographs • Satellite Images • Computers Electronic distance-measuring instruments • Inertial navaigation systems • Remote sensing • Applications of space science created new extensions of cartography’s reach • Internet increased its accessibility even to the layman • Automatic digitization of japan, < 17 seconds vs 17 years in 1821 (Inohtadatak
Internet increased its accessibility even to the layman http://onemap.sg/
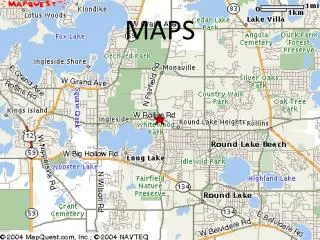
But... WHAT is a map? A reference tool to get to somewhere?
Define: Map VERY LIMITED DEFINITION Accurate?
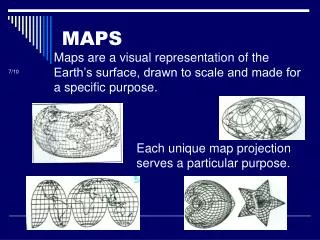
Maps: A more definitive definition • A map is defined as a representation, usually on a flat surface, of a whole or part of an area. • The job of a map is to describe spatial relationships of specific features that the map aims to represent. • There are many different types of maps that attempt to represent specific things. • Maps can display political boundaries, population, physical features, natural resources, roads, climates, elevation (topography), and economic activities. • Maps are produced by Cartographers. • General Reference Maps • Thematic Maps
GENERAL REFERENCE MAPS • Used to emphasize the geographic location of spatial phenomena. • E.g. Topographic Maps
Thematic Maps • A thematic map (or statistical map) is used to display the spatial pattern of a theme or attribute. It emphasizes the spatial pattern of one or more geographic attributes. • Uses of a thematic map includes: • Provide specific information about particular locations • Provide general information about spatial patterns • Compare patterns on two or more maps
Choropleth Map Description: These maps contain areas that are shaded or patterned in proportion to the statistical variable being displayed on the map. Data are aggregated over predefined areal units (politically-defined area or administrative—census or zip). Optimal uses: Best used when data are standardized (e.g., rates), discrete, and are evenly distributed within well-defined areal units. Design Considerations: Number of categories should be limited (between 3 and 7).
Dot Map Description: The spatial geometry of each mapped area is distorted to depict an attribute other than land area (e.g., population or income). Optimal Uses: Best accompanied by description of mapping techniques; can be constructed manually or digitally. Design Considerations: Methods are complex and interpretation can be difficult.
Graduated Circle Map Description: These maps contain symbols varying in size to show their relative quantitative values; used with point/location data. Optimal Uses: Best used when there is a lot of variation and range in the data; the goal is to show relative magnitudes of phenomena at specific locations. This is also good choice for count data. Design Considerations: Should not be used for standardized data such as rates or percentages.
S & M Graduated Circle Map Description: These maps contain symbols varying in size to show their relative quantitative values; used with point/location data. Optimal Uses: Best used when there is a lot of variation and range in the data; the goal is to show relative magnitudes of phenomena at specific locations. This is also good choice for count data. Design Considerations: Should not be used for standardized data such as rates or percentages.
Isoline Map Description:Isoline maps use line symbols to portray a continuous distribution such as temperature or elevation. Isolines are lines that connect equal points of equal numeric value. Optimal Uses: One of the best known types of isoline map is the contour map, which shows elevation above sea level. Design:
Isopleth Map Description: A contour map that depicts smooth continuous information (such as weather or pollution data); data are depicted using lines that connect points of equal numerical value. Optimal Uses: Serves as an effective method for highlighting spatial patterns in the data, as opposed to depicting discrete rates per enumeration area. Design Considerations: Requires understanding of various interpolation techniques.
Cartograms Description: The spatial geometry of each mapped area is distorted to depict an attribute other than land area (e.g., population or income). Optimal Uses: Best accompanied by description of mapping techniques; can be constructed manually or digitally. Design Considerations: Methods are complex and interpretation can be difficult.
Twitter Map http://research.larc.smu.edu.sg/palanteert/
More than Geography The five overlapping sub-disciplines of physical geography in the context of multi-disciplinary & Problem-oriented theme (Gregory, Gurnell & Petts, 2002) Lets take a closer look at this!
Analyzing Infectious Diseases • Why do we need to look at this? • The use of GIS in public health enables us to describe the environment of the person and its spatial and temporal complexity. • Disease mapping has made contributions to public health and epidemiology. GIS make it easier to map large databases of health events. • Helps determine the causes behind the emergence and the re-emergence of infectious disease
Jon Snow? • English Physician • One of the fathers of modern epidemiology • Epidemiology is the study of the patterns, causes and effects of health and disease conditions in definite populations. IOW, a spatial science.
H Jo^n Snow! Its spelt with a ‘H’
H 1831 Jo^n Snow!
Density Map of mosquito breeding sites in East Coast GRC, 2003 to 2005
Mapping and Geographic Information Systems • GIS is a key emerging and evolving industry throughout the world. • GIS careers exist in every imaginable discipline, from environmental science to commercial businesses and much more. This wide range of opportunities available lets you combine your passions or interests with GIS for a satisfying and successful career. • Careers in GIS can also encompass business development, managerial, and administrative roles.
Careers Mapping/geospatial jobs are varied and pervasive across many different fields. Mapping/Geospatial jobs range from part-time to full-time positions, and salary varies widely by location, discipline, and experience. Salary.com reports the range between $38,919 for an entry-level analyst to $103,333 for a GIS supervisor as of January 2006 (go find out the latest)! View the GISJobs.com Salary Survey for a more in-depth look at salaries.
Alternatively… you can consider being • Sherlock Holmes • Iron-Man
~ End ~ Join the Challenge!!!