Download
1 / 21
210 likes | 278 Views
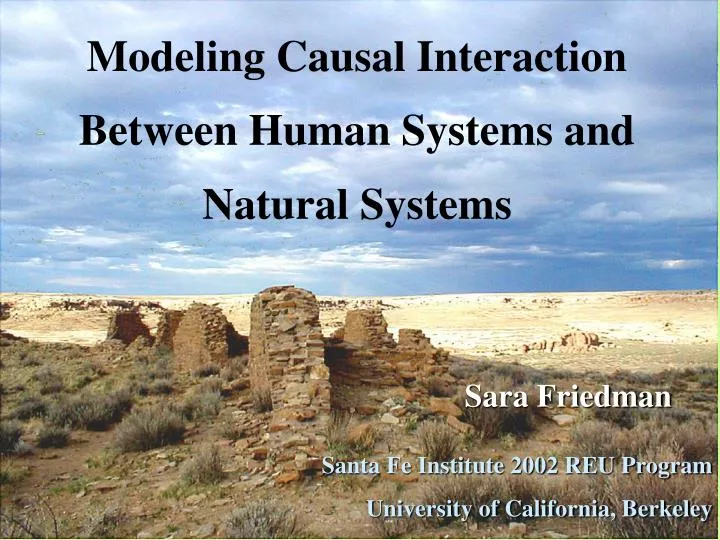
Modeling Causal Interaction Between Human Systems and Natural Systems. Sara Friedman Santa Fe Institute 2002 REU Program University of California, Berkeley. Motivation:. Fundamental natural processes are cyclic (e.g. topsoil maintenance)

E N D
Modeling Causal Interaction Between Human Systems and Natural Systems Sara Friedman Santa Fe Institute 2002 REU Program University of California, Berkeley
Motivation: • Fundamental natural processes are cyclic (e.g. topsoil maintenance) • Acyclic or unidirectional causal models are unrealistic in terms of describing our interaction with natural systems • How can we represent cyclic causal chains, and predict effects of interventions?
Presentation Outline • Existing mathematical causal theories: Graphical Models and Causal State Theory • Simulating a mutual causal process: Feedback Between Human Behavior and Environmental Quality • Conclusion: Creating Sustainable Causal Cycles Between Human Systems and Natural Systems • Related reading and acknowledgements
Graphical Models of Causality • No unified theory – large field encompassing many applications, approaches and formalisms • Definitions and theorems rely on DAGs for underlying structure (no recursion or feedback)
Causal State Theory • Mathematically embodies Occam’s Razor: causal states are minimally complex while maximally predictive • Very abstract – doesn’t use intuitive notion of “causal factors”, role of interventions is unclear – BUT • Innovative, rigorous, still in early stages of development
Summary of Causal Theories • Lots of insights, clever discovery algorithms and useful applications to everything from machine learning to epidemiology • At present, no unified general approach to mathematically describing causation • Need: Rigorous theory to analyze real world policy issues involving cyclic causal chains
Back to the issue at hand… • Interaction between human and natural systems is complex and involves factors which mutually affect each other (human behavior and environmental quality). • How to model this type of process? • What insights can the model give us regarding effects of interventions?
Simulate Feedback Effects Ecosystem Function (Renewable resource base) Human Culture (Prosociality/Restraint) Question: Under what conditions do the altruists take over and maintain patch productivity?
Patch Productivity: K Altruists: A’s Nonaltruists: N’s Frequency of A’s: P Average Payoff: W Initial Patch Productivity: Kzero = 100 Direct Dependence of W on K: B=1 Exploitation factor of an N: X=0.05 Growth increment of patches: k=0.3 Number of patches/groups: m=10 Individuals per group: n=10 Global updating percentage: g=0.8 Idiosyncratic updating rate: mut=0.5 Number of time steps: time=200 Payoff of an N on patch j: WNj = B Kj (1 + X) Payoff of an A on patch j: WAj = B Kj (1 + 0) Productivity of Patch j at time t: Kj(t) = Kj(t-1) [1– (Nj(t-1) X)](1+k) Note: Nj(t-1) is the number of N’s in j at t-1 Replicator Dynamic for t t+1: Pj = Pj (1-Pj) (WAj – WNj) / Wj Notice: since X > 0, ΔPj < 0 for all j How will the A’s ever survive?! Model Definitions and Equations
Without global updating or other group-level effects: Nearly Inevitable Crashes Problem! How to fix this?…
Group-Level Effects • Extinctions: If megapatch is degrading, extinctions become very likely on the least productive patches. Dead patches revitalize to prevailing megapatch average productivity, and colonization occurs, probably by a group with relatively high average payoff. Consequence: N-dominant patches will be replaced by the offspring of A-dominant groups, and between-group variance will increase Random assortation with colonization • • Institutions: Individuals in group j decide to do global updating or not en masse at each time step. • Consequence: the replicator dynamic could actually increase the A’s: (WA – WN) >? 0
Did it work? Will the A’s (and the megapatch) survive?… Results This run with default parameters and group-level effects shows how feedback can create homeostatic-like dynamics. Also, stochasticity (i.e. luck) had major effects on outcomes; the initial distribution of altruists set important conditions for the degree of between-group variance relative to within-group variance.
Group Size and Global Updating were Key Parameters • Small n increased between-group variance relative to within-group variance, augmenting the influence of both group-level effects: extinctions and global updating. • Global updating worked especially well when there were “ideal patches” (mostly altruists, high patch productivity) to copy, and additionally when most of the A’s lived on ideal patches. The “ideal patch” effect is an outcome of high between-group variance, relative to within-group.
How do we know g and n were such important parameters?… Correlation of Total Altruist Frequency with Average Patch Productivity, Varying g & n Each histogram represents 200 runs, under default parameter conditions, except global updating and group size varying as stated.
Conclusion: Altruists can do well with group level effects, when the differences between groups are more significant than the differences within the groups. Small groups who can see how people in other patches are doing will protect their resource base, more than large groups who don’t look globally as much.
But what does this really tell us? • The model is extremely simple; the simulation was written in R. It is not spatial or agent-based, and fails to capture realistic patch-boundary or group-size dynamics. BUT • The process of simulating gives heuristic insights into dealing with causal cycles…
Cybernetic View of Model And now for the big picture…
Creating Sustainable Causal Cycles Between Human & Natural Systems • Interventions in cyclic causal chains have different effects over time (the nth time around) than they do initially. Directly applying interventions deduced from acyclic causal models to cyclic socio-ecological processes can potentiate maladaptive decisions. • In a cyclic model, to control runaway or autocatalytic effects, look for links where the driving deviations are being amplified. Try to correct or compensate for the deviations rather than exaggerating them.
Related Reading • Sam Bowles & Astrid Hopfensitz, The Co-evolution of Individual Behaviors and Social Institutions • Jung-Kyoo Choi, Play Locally, Learn Globally: The Structural Basis of Cooperation • Cosma Shalizi & Jim Crutchfield, Computational Mechanics: Pattern and Prediction, Structure and Simplicity • Marcus Feldman & Kevin Laland, Gene-Culture Coevolutionary Theory • Donald Grayson, The Archaeological Record of Human Impacts on Animal Populations • Judea Pearl, Causality: Models, Reasoning, and Inference • Peter Spirtes et al, Causation, Prediction, and Search • Robert Edgerton, Sick Societies: Challenging the Myth of Primitive Harmony • Simon Levin, Fragile Dominion: Complexity and the Commons
Thanks to: Sam Bowles Jeff Brantingham Cosma Shalizi Jim Crutchfield Paolo Patelli, Bae Smith, and Dave Krakauer Santa Fe Institute Dan Friedman