Download
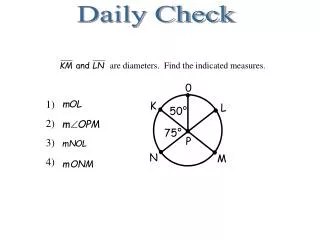
1 / 28
280 likes | 303 Views
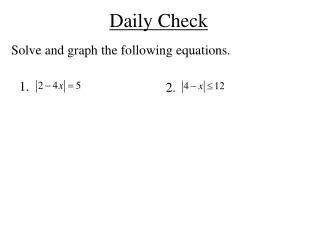
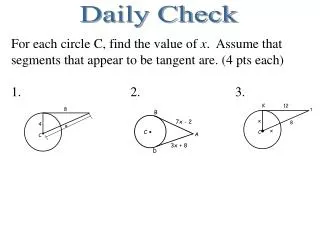
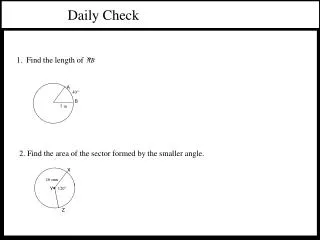
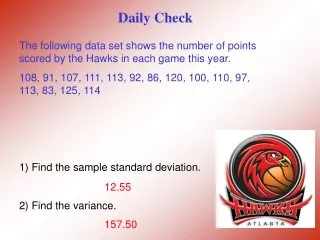
Daily Check. The following data set shows the number of points scored by the Hawks in each game this year. 108, 91, 107, 111, 113, 92, 86, 120, 100, 110, 97, 113, 83, 125, 114 Find the sample standard deviation. Find the variance. 12.55. 157.50. Math II.

E N D
Daily Check • The following data set shows the number of points scored by the Hawks in each game this year. • 108, 91, 107, 111, 113, 92, 86, 120, 100, 110, 97, 113, 83, 125, 114 • Find the sample standard deviation. • Find the variance. 12.55 157.50
Math II UNIT QUESTION: Can real world data be modeled by algebraic functions? Standard: MM2D1, D2 Today’s Question: How do you use a score to find probabilities of events? Standard: MM2D1d
Who should get the Gold? In the heptathlon, women compete in 7 events: the 200-m and 800-m runs, 100-m high hurdles, shot put, javelin, high jump, and long jump. To determine the Gold medal winner, all of the performances in the 7 events need to be combined into one single score. Races are measured in seconds. Distances are measured in meters (or centimeters). How can these events be compared?
Who should get the Gold? 2000 Sydney Olympics Gertrud Bacher from Italy Won 800 meter run in 129 seconds. The mean of all runners was 137 seconds with a standard deviation of 5 seconds.
Who should get the Gold? 2000 Sydney Olympics Yelena Prokhorova (Russia) Won the long jump with a jump of 660 cm. The mean jump was 600 cm with a standard deviation of 30 cm.
Who’s result was more unusual? Unusual results are far from the mean. We need to compare distance from the mean using the same scale. Use the standard deviation as the scale, that is, as a ruler.
How far from the mean? The z value tells you how many standard deviations you are away from the mean.
Who should get the Gold? Bacher (Italy) Prokhorova (Russia)
Who should get the Gold? Bacher (Italy) Prokhorova (Russia) Prokhorova is further from the mean, so she deserves the Gold….
Not exactly… We only considered two events The heptathlon has 7 events
Not exactly… Yelena Prokhorova actually won the Silver medal. (She won the Gold at the 2001 World Championships.) Gertrud Bacher placed 14th. The Gold was won by Denise Lewis of Great Britain.
Example A town’s (not Atlanta) January high temperatures average 36°F with a standard deviation of 10°, while in July the mean high temperature is 74°F and the standard deviation is 8°. In which month is it more unusual to have a day with a high temperature of 55°F July
Standardized Test Score Example • Mary’s ACT score is 26. Jason’s SAT score is 900. Who did better? • The mean SAT score is 1000 with a standard deviation of 100 SAT points. The mean ACT score is 22 with a standard deviation of 2 ACT points. • Who did better? Mary
The Standard Normal Curve • Theoretically perfect normal curve • Use to determine the relative frequency of z-scores and raw scores • Proportion of the area under the curve is the relative frequency of the z-score • Rarely have z-scores greater than 3 (.26% of scores above 3, 99.74% between +/- 3)
The Standard Normal Curve • Mean is 0, Standard Deviation is 1.
z scores are sometimes called standard scores Here is the formula for a z score: Z scores A z score is a raw score expressed in standard deviation units. It is the number of standard deviations a number is from the mean. What is a z-score?
Why z-scores? • Transforming scores in order to make comparisons, especially when using different scales • Gives information about the relative standing of a score in relation to the characteristics of the sample or population • Location relative to mean • Relative frequency and percentile
The Standard Normal Table • A table of areas under the standard normal density curve. The table entry for each value z is the area under the curve to the left of z.
The Standard Normal Table • The table can be used to find the proportion of observations of a variable which fall to the left of a specific value zif the variable follows a normal distribution.
Example 1: Calibrating Your GRE Score GRE Exams between 10/1/89 and 9/30/92 had mean verbal score of 497 and a standard deviation of 115. (ETS, 1993) • Suppose your score was 650and scores were bell-shaped. • Standardized score = (650 – 497)/115 = +1.33. • Table, z = 1.33 is between the 90th and 91st percentile. • Your score was higher than about 90% of the population.
Example 2: Removing Moles Company Molegon: remove unwanted moles from gardens. Weights of moles are approximately normal with a mean of 150 grams and a standard deviation of 56 grams. Only moles between 68 and 211 grams can be legally caught. • Standardized score = (68 – 150)/56 = –1.46, and Standardized score = (211 – 150)/56 = +1.09. • Table: 86% weigh 211 or less; 7% weigh 68 or less. • About 86% – 7% = 79% are within the legal limits.
Your Turn! Suppose it is known that verbal SAT scores are normally distributed with a mean of 500 and a standard deviation of 100. Find the proportion of the population of SAT scores are less than or equal to 600. First we need to find the standardized score: Z-score=(observed value-mean)/(standard deviation) =(600-500)/100 = +1 From Table 8.1 we see that a z-score of +1 is the 84th percentile and the proportion of population SAT scores that are less than or equal to 600 is 0.84.
Estimate the proportion of population SAT scores that are between 400 and 600. An observed value of 400 has a z-score of -1 and represents the 16th percentile (proportion below z = -1 is 0.16). An observed value of 600 has a z-score of +1 and represents the 84th percentile (proportion below z = +1 is 0.84). Let’s draw a picture….
So the proportion with scores between 400 and 600 =Proportion below 600 – Proportion below 400 = 0.84 - 0.16 = 0.68