Download
1 / 18
180 likes | 258 Views
Explore the relationship between growth rate and plant size using regression designs and ANCOVA to study various factors affecting plant growth. Understand the impact of covariates like salmon presence and fertilizer treatment on growth rates.

E N D
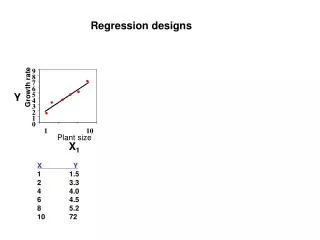
9 8 7 Growth rate 6 Y 5 4 3 2 1 0 Regression designs 1 10 Plant size X1 X Y 1 1.5 2 3.3 4 4.0 6 4.5 8 5.2 10 72
9 9 8 8 7 7 Growth rate Growth rate 6 6 Y Y 5 5 4 4 3 3 2 2 1 1 0 0 1 10 Plant size X1 Regression designs 1 10 Plant size X1 X Y 1 1.5 2 3.3 4 4.0 6 4.5 8 5.2 10 72 X Y 1 0.8 1 1.7 1 3.0 10 5.2 10 7.0 10 8.5
9 9 9 8 8 8 7 7 7 Growth rate Growth rate Growth rate 6 6 6 Y Y Y 5 5 5 4 4 4 3 3 3 2 2 2 1 1 1 0 0 0 0 1 1 10 Plant size Plant size X1 X1 Regression designs Code 0=small, 1=large 1 10 Plant size X1 X Y 1 1.5 2 3.3 4 4.0 6 4.5 8 5.2 10 7.2 X Y 1 0.8 1 1.7 1 3.0 10 5.2 10 7.0 10 8.5 X Y 0 0.8 0 1.7 0 3.0 1 5.2 1 7.0 1 8.5
9 8 7 Growth rate 6 Y 5 4 3 2 1 0 0 1 Plant size X1 Code 0=small, 1=large Growth = m*Size + b Questions on the general equation above: 1. What parameter predicts the growth of a small plant? 2. Write an equation to predict the growth of a large plant. 3. Based on the above, what does “m” represent? X Y 0 0.8 0 1.7 0 3.0 1 5.2 1 7.0 1 8.5
Growth of small Difference in growth 9 8 7 Growth rate 6 Y 5 4 3 2 1 0 0 1 Plant size X1 Code 0=small, 1=large Growth = m*Size + b If small Growth = m*0 + b If large Growth = m*1 + b X Y 0 0.8 0 1.7 0 3.0 1 5.2 1 7.0 1 8.5 Large - small = m
What about “covariates”… - looking at the effect of salmon on tree growth rates Nitrogen
Compare tree growth around 2 streams, one with and one without salmon Salmon No Salmon Growth rate (g/day) t(9) = 0.06, p = 0.64
ANCOVA In an Analysis of Covariance, we look at the effect of a treatment (categorical) while accounting for a covariate (continuous) Salmon No Salmon Growth rate (g/day) Plant height (cm)
Salmon No Salmon ANCOVA Fertilizer treatment (X1): code as 0 = No Salmon; 1 = Salmon Plant height (X2): continuous Growth rate (g/day) Plant height (cm)
? Salmon No Salmon ? ANCOVA Fertilizer treatment (X1): code as 0 = No Salmon; 1 = Salmon Plant height (X2): continuous X1*X2 0 0 : 1 2 5 X1 X2 Y 0 1 1.1 0 2 4.0 : : : 1 1 3.1 1 2 5.2 : : : 1 5 11.3 Growth rate (g/day) Plant height (cm)
Salmon No Salmon ANCOVA • Fit full model (categorical treatment, covariate, interaction) Y=m1X1+ m2X2 +m3X1X2 +b Growth rate (g/day) Plant height (cm)
ANCOVA • Fit full model (categorical treatment, covariate, interaction) • Y=m1X1+ m2X2 +m3X1X2 +b • Questions: • Write out equation for No Salmon (X1= 0) • Write out equation for Salmon (X1 = 1) • What differs between two equations? • If no interaction (i.e. m3 = 0) what differs between eqns?
If X1=0: Y=m1X1+ m2X2+m3X1X2 +b Difference if no interaction: m1 +m3X2 ANCOVA • Fit full model (categorical treatment, covariate, interaction) • Y=m1X1+ m2X2 +m3X1X2 +b If X1=1: Y=m1 + m2X2 +m3X2 +b Difference: m1 +m3X2
Difference between categories…. Constant, doesn’t depend on covariate Depends on covariate = m1 + m3X2 (interaction) = m1 (no interaction) 12 10 8 Growth rate (g/day) Growth rate (g/day) 6 4 2 0 0 2 4 6 Plant height (cm) Plant height (cm)
Salmon No Salmon ANCOVA • Fit full model (categorical treatment, covariate, interaction) • Test for interaction (if significant- stop!) If no interaction, the lines will be parallel Growth rate (g/day) Plant height (cm)
ANCOVA • Fit full model (categorical treatment, covariate, interaction) • Test for interaction (if significant- stop!) • Test for differences in intercepts between lines = m1 } m1 Growth rate (g/day) No interaction Intercepts differ Plant height (cm)
Multiple X variables: Both categorical …………... ANOVA One categorical, one continuous……………...ANCOVA Both continuous …………....Multiple Regression
Regression’s deep dark secret: Order matters! Input: height p=0.001 weight p=0.34 age p=0.07 Input: height p=0.001 age p=0.04 weight p=0.88 Why? In the first order, even though weight wasn’t significant, it explained some of the variation before age was tested. Common when x-variables are correlated with each other.