Dyed Sand Lab Book
460 likes | 817 Views
Dyed Sand Lab Book. Donna S. Lutz Iowa State University 2000. COE Dyed Sand Study Major Objectives. Use dyed sand to trace dredge material movement in river system Find appropriate dye to dye sand particles Develop fluorometry procedure to identify presence of dyed sand

Dyed Sand Lab Book
E N D
Presentation Transcript
Dyed Sand Lab Book Donna S. Lutz Iowa State University 2000
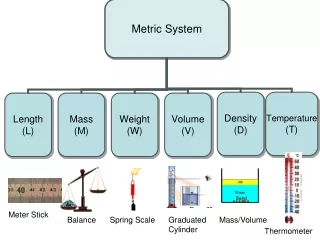
COE Dyed Sand StudyMajor Objectives • Use dyed sand to trace dredge material movement in river system • Find appropriate dye to dye sand particles • Develop fluorometry procedure to identify presence of dyed sand • Evaluate the background interference caused by chlorophyll 10/3/00
Supplied by the COE 0.6 mm sand, 227g w/ 3.2 g dye Signal Green SG (534 nm) Saturn Yellow SY(563 nm) Rocket Red RR (614 nm) Horizon Blue HB(477 nm) nm are dominant %transmittance / reflectance supplied by Dayglo Dayglo dyed sand 10/3/00
Testing Solvents • Prepared samples by dissolving 10 grains of 4 dyed sands in about 4.5 ml petroleum ether, 90% acetone, methylene chloride and water in 16x125mm test tube. Each tube was inverted 50 times, then vortex mixed for 15 sec. • Results, dye was soluble in acetone and methylene chloride but not in water or petroleum ether (These results were later confirmed by Dayglo) 10/3/00
Interference w/ chlorophyll • Chlorophyll pigment extractions (90% actetone) were examined under blue filter black light BLB (St 1, 10 and 7 from Sayl 1248) • BLB wavelength 365nm (345-400nm) • It was determined that chlorophyll does indeed fluoresce in the red light spectrum • Main wavelength for chlorophyll is 630-665nm • Recommend using dye outside this range 10/3/00
Preparation of Dyed Sand/Sand samples • 2g 0.6mm sand with 0.1g of each of four dyes added • Photo was taken under BLB of dry mixture • Samples were dissolved in about 4.5 ml 90% acetone, inverted and mixed • BLB photo taken 10/3/00
Notes from 10/3/00 • HB dye may be a good choice, however trace fibers also fluoresce blue • wavelength 477 is outside chlorophyll range • it appears to fluoresce well • Solvent could be acetone or methylene chloride MeCl • Have ordered cells for Turner machine, should arrive in 2-3 days
To do next • Will prepare chlorophyll sample using MeCl to compare • Dyed Sand/Sand samples could be centrifuged to remove turbidity • Will prepare Dyed Sand samples without the 2g sand to compare • Will arrange to use spectrofluorometer to define excitation and emmission filter selection for Turner fluorometer
Labwork 10/9/00 • Document lighting arrangement - COE’s results are brighter, either it’s our lighting or imaging • Investigate effect of centrifugation on turbidity • Prepare samples of only 0.1g dyed sand with 90% acetone to compare to COE samples
Notes from 10/9/00 • COE lighting system is better • Centrifuging at 3000 rpm for 10 min is adequate to remove turbidity
Work done 10/18/00 at Dr Jenks Lab • 5 dye samples, chorophyll (St 7 from Week 1248), acetone blank and sand/acetone blank were run • Scanning spectrophotometer was used to determine excitation wavelength • Using determined excitation wavelength samples were run on scanning spectrofluorometer • Dyed samples were dilute (20 drops from 0.1g dye to 4.5ml acetone samples diluted to 3 ml) • Chlorophyll sample was not diluted
Questions to Ask 1. Overall, what do the ISU spectrograms tell us? 2. What are the spectrograms from DayGlo and why don't they match any of our results? 3. Using a fluorometer, which dye would be the most detectable (and distinguishable from backgound, i.e. acetone, chlorophyll and sand)?
1. What do the spectrograms tell us? • The spectrophotometer output shows us what the excitation wavelength is for each sample. It is assumed that if we excite the sample at it’s peak excitation wavelength we will see the greatest peaks in the spectrofluorometer output. • The scanning spectrofluorometer shows us at what wavelength the sample fluoresces at, given that specific excitation wavelength • The peaks seen in the photometry output are mirrored with peaks in the fluorometry output, as expected
1. What do the spectrograms tell us? (cont’d) • Acetone gave a huge absorbance between 210 and 345 nm which was mirrored in the spectrofluorometer results at 850 nm and above • Chlorophyll had two distinct peaks in absorbance at 433 and 663 nm • Turbidity needs to be eliminated to reduce noise/interference (see undyed sand-acetone results) • Acetone blank will always have to be used and acetone subtracted from results
2. What are the spectrograms from DayGlo and why don’t they match our data? • Conference call 10/19 with N McVay, Corps and Dick Bonsutton, DayGlo • DayGlo graphs are from a spectrophotometer using dried paint samples • Measured parameter was reflectance • Not considered strange that our dyed sand-acetone samples would have different optical characteristics
3. Using a fluorometer, which dye would be the most detectable (and distinguishable from backgound, i.e. acetone, chlorophyll and sand)? • For best detection, the selected dye should have an excitation wavelength outside of the range 210-345 nm, 620-675 nm and 400-500nm. Thus, HB, RR and AP are candidates, however, HB may be a little close to acetone. • HB has the sharpest fluorometer peak but it is excitated near chlorophyll’s excitation wavelength. • AP and RR appear to be good choices at this time.
Comparison of Excitation Wavelengths • RR and AP may be the best dyes to detect by flluorometry because they excite at different wavelengths than either acetone or cholorphyll
What to do next? • Return to Dr Jenk’s lab and • Excite AP, chlorophyll and acetone at AP’s excitation wavelength (555nm) and compare spectrofluorograms • Excite RR, chlorophyll and acetone at RR’s excitation wavelength (527nm) and compare spectrofluorograms • Excite HB, chlorophyll and acetone at HB’s excitation wavelength (365nm) and compare spectrofluorograms • Explore if it is possible to select the emission wavelength and scan the excitation wavelengths
2nd trip Dr Jenk’s Lab 10/23/00 • Samples were 10 dyed sand grains dissolved in 4.5 ml 90% acetone, acetone blank and chlorophyll sample from St 1 for Sayl 1248 (undiluted) • Redid scans with spectrophotometer to verify excitation wavelength for the dyes, AP, RR, and HB. • Optical density from these samples was below the optimum 0.1 to 0.3 range. • AP had the highest peaks on the spectrophotometer scans, it was difficult to discern significant peaks for HB. • Spectrophotometer scans revealed the same excitation wavelength for AP (555 nm) and RR (530 nm).
Spectrofluorograms from 10/23/00 • Excited AP, chlorophyll and acetone at AP’s excitation wavelength (555nm) and compared spectrofluorograms; AP peaks are different than acetone but are masked by chlorophyll • Excited RR, chlorophyll and acetone at RR’s excitation wavelength (530nm) and compared spectrofluorograms; RR peaks are different than acetone but are masked by chlorophyll • Excite HB, chlorophyll and acetone at HB’s possible excitation wavelengths (370nm and 730 nm) and compared spectrofluorograms; no good HB detection at 730nm, but there could be far end (>790nm) peak for HB that would be distinguishable. • Was told it was not advisable to select the emission wavelength and scan the excitation wavelengths on the fluorometer; that the spectrophotometer would give better results.
Conclusions from 2nd lab Jenks lab study • AP has highest optical density of the samples, which may mean greater detection and it is easily distinguished from acetone • However, chlorophyll can block all dyes at their excitation wavelengths. • Will need to minimize chlorophyll contamination in the sample before dissolving dye in order to measure spectrally.
What to do next? • Might be worth taking one more look at HB and extend the scan to the maximum 880 nm • Then the focus should be on how to reduce the effect of chlorophyll • physically remove chlorophyll through sample preparation • mechanically shake, rinse samples, dry, centrifuge and filter? • If the Corps wants to pursue this avenue further, we’d want “real” samples from the river with undyed sand and dyed sand (AP or RR).