Download
1 / 23
230 likes | 370 Views
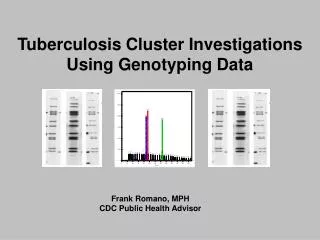
National Tuberculosis Genotyping Service. Patrick K. Moonan, DrPH, MPH Surveillance, Epidemiology, and Outbreak Investigation Division of Tuberculosis Elimination Northeast TB Controllers Princeton, NJ October 24, 2006. National Genotyping Service. Richmond, CA. Lansing, MI.

E N D
National Tuberculosis Genotyping Service Patrick K. Moonan, DrPH, MPH Surveillance, Epidemiology, and Outbreak Investigation Division of Tuberculosis Elimination Northeast TB Controllers Princeton, NJ October 24, 2006
Richmond, CA Lansing, MI CDC – Atlanta, GA
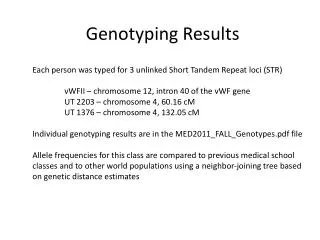
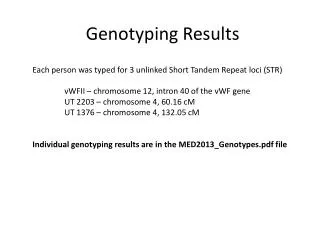
National Genotyping Service • Began in January, 2004 • CDC contracts with 2 reference laboratories • Genotype up to 5,000 isolates/lab/year • Genotype at least 1 isolate for each new culture-positive case of TB
National Genotyping Service Genotyping Isolates Analysis & Distribution Acquiring Isolates Public Health and Clinical Laboratories Contract Reference Laboratories State and Local TB Programs
Isolate and Data Flow Other Labs CDC isolates & data Genotyping Lab results State Lab TB Program patientnames
How are we doing? • As of October 20, 22,257 isolates have been submitted for typing • 2 Quarterly Reports have been distributed • CDC Webpage is under construction • Future home for: • Genotyping education materials • Quarterly reports • National Database Interface (Kansas Model)
How are we doing? • 34 of 53 (64.2%) participating programs have submitted updated RVCT linking variables through 6/30/2006 • Aberration detection program has been developed to identify outbreak from a national perspective
How are we doing? • 34 of 53 (64.2%) participating programs have submitted updated RVCT linking variables through 6/30/2006 • Aberration detection program has been developed to identify outbreaks from a national perspective
4 3 1 3 1 1 4 2 2 1 9 30 1 1 1 1 2 1 3 4 1 2 6 1 1 1 6 1 Number of isolates as of 10/31/2005 n = 46 IN = 65.2% of isolates (Note: 1 case in Florida matches on spoligotype and is missing MIRU but is linked epidemiologically) Spoligo: 777776777760601 MIRU: 224221153323
4 3 1 3 1 1 4 2 2 +1 +4 1 +1 +6 1 1 2 1 +1 +1 1 0 6 1 1 1 6 +2 Net gain in clustered isolates 10/31/2005 to 10/01/2006 Spoligo: 777776777760601 MIRU: 224221153323
Geography and Genotyping 7 • Number of Indiana isolates as of 10/01/2006 (n = 36) • County A (n = 25) • 69.5% of state total • 40.3% of national total • County B (n = 7) • all six cases are linked epidemiologically to County A cases • Other Counties • No clear epidemiologic link has been identified to these cases through interviews and records review of County A and B cases 25 2 1 1
Figure 1. Derivation of genotype isolates 17,653 Isolates (Jan 1, 2004 to Jun 30, 2006) 7,000 (39.6%) Incomplete genotyping results, duplicate results or missing RVCT 10,653 Isolates Non-duplicates with RVCT 323 (3.0%) Non-matching RVCT 10,330 Isolates Included in analysis
NTGS Preliminary Analyses • 6,706 (64.9%) clustered isolates • 1,974 clusters • Median of 3 members • Range: 2 – 687 • Key characteristics for clustering
NTGS Preliminary Analyses • 6,706 (64.9%) clustered isolates • 1,974 clusters • Median of 3 members • Range: 2 – 687 • Key characteristics for clustering
NTGS Preliminary Analyses • 6,706 (64.9%) clustered isolates • 1,974 clusters • Median of 3 members • Range: 2 – 687 • Key characteristics for clustering
NTGS Preliminary Analyses • 181 MDR-TB isolates in database • 100 (55.2%) clustered (within state) • OR = 1.41 (95% CL 1.05, 1.89) • 1,183 Mono-resistant TB isolates in database • 579 (48.9%) clustered (within state) • OR = 1.10 (95% CL 0.97, 1.24)
Tell us how we can do better pmoonan@cdc.gov 404.639.5310 lcowan@cdc.gov 404.693.1481