NHL Shootouts
150 likes | 288 Views
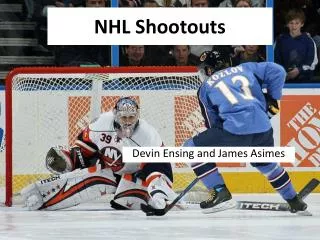
NHL Shootouts. Devin Ensing and James Asimes. What is a Shootout?. First instituted in the NHL after the lockout, in the 2005-06 season Used as a way to end games that are tied after overtime

NHL Shootouts
E N D
Presentation Transcript
NHL Shootouts Devin Ensing and James Asimes
What is a Shootout? • First instituted in the NHL after the lockout, in the 2005-06 season • Used as a way to end games that are tied after overtime • Each team takes three attempts with three separate players, and the team with more goals at the end of the three shooters wins. If the teams are still tied, there is sudden death with new shooters until a winner is determined. • Many criticisms of the shootout, including that it no longer makes hockey a team game. Also many purists object to the implementation of the shootout. • Previously used in the Olympics, most notably deciding the 1994 gold medal game in Lillehammer, Norway.
Best Shooters: Highest Shooting Percentage League Scoring Average: 33.91% Minimum 10 Shots • PetteriNummelin 8/10 = 80.00 • WojtekWolski 16/24 = 66.67 • Patrick Kane 9/15 = 60.00 • Jeremy Roenick 6/10 = 60.00 • Joe Pavelski 13/22 = 59.09 • Trevor Linden 7/12 = 58.33 • VyacheslavKozlov 22/38 = 57.89 • Erik Christensen 17/31 = 54.84 • TuomoRuutu 6/11 = 54.55 • JussiJokinen 22/41 = 53.66
Worst Shooters:Lowest Shooting Percentage League Scoring Average: 33.91% Minimum 10 Shots • Marian Gaborik 1/13 = 7.69 • Taylor Pyatt 1/12 = 8.33 • Alexei Ponikarovsky 1/12 = 8.33 • Mark Recchi 1/10 = 10.00 • Stephen Weiss 2/14 = 14.29 • Marc Savard 2/13 = 15.38 • DanyHeatley 3/19 = 15.79 • Michael Ryder 2/12 = 16.67 • Sergei Brylin 2/12 = 16.67
Shootout Goal PercentageMinimum 10 AttemptsLeague Average: 33.91%
Best Goalies:Highest Save Percentage League Save Average: 0.668 Minimum 30 Shots • Johan Holmqvist 32/37 = 0.865 • Marc Denis 35/41 = 0.854 • Mathieu Garon 56/69 = 0.812 • Jose Theodore 47/59 = 0.797 • Johan Hedberg 41/52 = 0.788 • HenrikLundqvist 128/169 = 0.757 • MikaelTellqvist 34/45 = 0.756 • Jonas Hiller 27/36 = 0.750 • Rick DiPietro 79/106 = 0.745 • Kari Lehtonen 67/90 = 0.744
Worst Goalies:Lowest Save Percentage League Save Average: 0.668 Minimum 30 Attempts • Jason LaBarbera 15/31 = 0.484 • Martin Biron 25/49 = 0.510 • Curtis Sanford 18/35 = 0.514 • Sean Burke 17/33 = 0.515 • VesaToskala 31/59 = 0.525 • Ray Emery 22/39 = 0.564 • Evgeni Nabokov 51/90 = 0.567 • NiklasBackstrom 42/74 = 0.568 • Ty Conklin 20/35 = 0.571 • Peter Budaj 46/79 = 0.582
Shootout Save PercentageMinimum 30 AttemptsLeague Average: 0.668
Longest Scoring Streak JussiJokinen Left Wing, CAR Hurricanes • ScoringStreak: 9 (Nov. 05, 2005 - Mar. 07, 2006) • Career Shootout Stats: 22/41 = 53.66%
Longest Scoreless Streak Trent Hunter Right Wing, NY Islanders • Scoreless Streak: 13 (Mar. 10, 2006 - Current) • Career Shootout Stats: 5/20 = 25.0 %
Unlikely Streaks? How likely is it that JussiJokinen, with a career shooting percentage of 53.66%, would score on nine straight shootout attempts? P(Jokinen 9 consecutive goals) = 0.0036886 How likely is it that Trent Hunter, with a career shooting percentage of 25.0%, would not score on 13 straight shootout attempts? P(Hunter 13 consecutive misses) < 0.0000001
“All-Star” Shootout Analysis • League Goal Average in the shootout is .3319 • The Western Conference’s avg is .379032 • The Eastern Conference’s avg is only .289634 • Why could this be? • Pierre LeBrun article on ESPN • League Save Average in the shootout is .668 • The Western Conference’s avg is .662461 • The Eastern Conference’s avg is .740525
Class Activity • All Star Shootouts! • Open NHLAllStarShootouts.MPJ on P:\Data\MATH\Hartlaub\SportsStats
References • NHL.com • nhlshootouts.com • ESPN.com • JussiJokinen: Shootout Specialist Article • http://sports.espn.go.com/nhl/columns/story?columnist=lebrun_pierre&id=3996052