Download

1 / 36
520 likes | 1.23k Views
Improving the Supply Chain of Tilapia Industry in the Philippines. Wilfred E. Jamandre , Central Luzon State University ( CLSU ) Upton Hatch, North Carolina State University ( NCSU ) Remedios B. Bolivar, Central Luzon State University ( CLSU )

E N D
Improving the Supply Chain of Tilapia Industry in the Philippines Wilfred E. Jamandre, Central Luzon State University (CLSU) Upton Hatch, North Carolina State University (NCSU) Remedios B. Bolivar, Central Luzon State University (CLSU) Russell Borski, North Carolina State University (NCSU)
Objectives • Develop tilapia supply chain maps • Analyze tilapia supply chain performance • Identify areas for improvement in supply chain • Provide recommendations
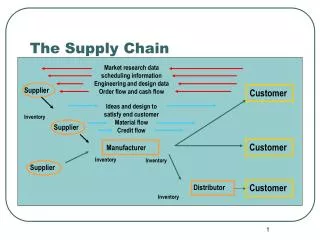
Methodology INPUT PROCESS OUTPUT • SCM • New Institutional Economics: • Relationship Marketing • Operations Management and Logistics • Supply Chain Maps • Performance of tilapia supply chain • Areas for improvement in the supply chain • (Other recommendations) • The Philippine Tilapia Industry • Chain actors, key activities and roles, • Flows of product, information and payments • Costs and margins associated with each practice • External influences
Study Areas and Coverage • Regions I, III, IV, CAR and NCR • 5 hatchery and nursery operators • 28 farmers • 4 processors • 24 traders/consolidators/shippers • 11 institutional buyers
Data Gathered • key players, their roles/activities/services • product grades and standards • product, information and payment flows • logistics issues • production and marketing • external influences
Highlights of the Philippine Tilapia Industry • 12% of GDP from aquaculture • 1.4 million workforce and fish producers • source of food and animal protein • 3.81 kgs per capita consumption • 10% average annual growth rate (2005-2008) • 14% of the total food expenditure BAS, (2010) and Rodriguez, et.al. (2009) Tagaytay
Highlights of the Philippine Tilapia Industry • 258,663MT production (BAS 2010). • 80% from Regions III and IV • Top 5 provinces: • Pampanga (37.68%), Batangas(21.06%), Laguna (4.64%), Rizal (4.06%) and Bulacan(3.58%). • Culture environments: • 57% freshwater fishponds • 38% freshwater fish cages • 7% brackishwater fishpond • 1% freshwater fishpen(BFAR, 2004)
Highlights of the Philippine Tilapia Industry • Types of tilapia: • Nile Tilapia • 87% to total tilapia production in 2000 (BFAR, 2001) • Red Tilapia (Mozambique) • BFAR GET Excel • Genomar Supreme Tilapia (GST)
Highlights of the Philippine Tilapia Industry • Industry’s growth drivers: • genetic improvement • stock management and cultural practices • Market niches: • product forms - filleted, dried, whole fish • outlets - supermarkets, food chains Tagaytay
Tilapia Supply Chain Major Players Live/Frozen Traders (Wholesaler, Consignacion, Viajero, Retailer) Small-scale trader Retailer Hatchery Operators Institutional buyers Fish Producers Processors End-users Improved brood stocks Ponds Cages Pens Improved quality tilapia Supermarkets Specialty shops Food Chains Restaurants Bars, canteens, etc. Nursery Operators Live Fillet Grilled Barbecued Specialty menus
Nursery operators • Maintain fry up to marketable sizes: • 22-20 on-season months (May, June, July, August) • 14-12 off-season (September, October, November, December) • Prefer Nile tilapia Bicol
Hatchery operators • Supply fry and fingerlings (400 thousand fry every 18 days) • Provide techno-guides to fish producer – customers • Handle about 3,000 breeders (GIFT -CLSU) • Maintain nursery ponds
Fish producers • produce marketable tilapia • 2.5 – 3 months (4-5 pieces per kg) • 3.5-4.5 months (2-3 pieces per kg)
Wholesalers & Retailers • Wholesalers • shippers or viajeros • Retailers • Resellers • Handle 100-150 kg of live fish, daily (5-6 pieces per kg)
Traders & Consolidators Traders - buy, sell and distribute Consolidators • Supply supermarkets • Facilitators • Price monitor • Small-scale trading • Gatekeepers
Processors • Fillet, dried, whole, frozen and choice portions or trimmings • Dressing recovery: • 1 kg raw tilapia (2-3 pieces) yields 30-35% fillet, 18% belly, 25% innards, 21% head and 1% skin
Institutional Buyers & Household Consumers (Key Customers) • Institutional Buyers (Supermarkets, Specialty Shops, Food Chains, Restaurants) • Household consumers
Product Forms • Preferred by household customers • live whole tilapia • size of 4-5 pieces per kg (200 - 250 g per fish) • Northern Luzon markets prefer darker-skinned tilapia • The common food recipes are charcoal grilled, fried, boiled and “paksiw” • Preferred by hypermarkets • live whole fish • size of 3-4 pieces per kg (250 – 350 g per fish)
Product Forms • Specialty shops and food chains in major urban centers • tilapia fillet (350 g per pack) • whole frozen fish (2-3 pieces per kg) • dried fish (100 g per pack or 30-35 g per fish) • by-products of filleting - fish soups, tilapia belly and deep fried tilapia skin
Volume Requirements • Major customers in Luzon 5,335 kgs average daily or 1, 947,275 kgs (or ~ 1,947.28MT) yearly • Annual national consumption requirement: 323,850 MT (~ 1% )
Major routes MAJOR DEMAND CENTERS MAJOR TRANSSHIPMENT POINT MAJOR SUPPLY CENTERS Angeles Hatcheries Marketable fish Fries Baguio City Cordillera Administrative Region Pampanga Dagupan City Laguna Cagayan Valley Isabela Ilagan Marketable fish Batangas La Union & Ilocos Provinces Tilapia Fries Malabon Camarines Sur Metro Manila
Product Flow (Bicol-Laguna/Batangas-Manila/Baguio Route) (live) Trader Local market Marketable size (live) Specialty shop - Monterrey (Manila, Tuguegarao) Hatchery Nursery Laguna Grow-out pond Semi-intensive Laguna/Rizal Fingerlngs (frozen) (live) Processors Fastfood shop 3 months conditioning (live/frozen) FRY Consolidator/Trader Supermarket (live) Cage operator Batangas/Taal Hatchery/Nursery Batangas Trader Local market Local market (live) Central fish market (Malabon) (live) FRY Marketable size tilapia (live) Wholesale shipper “viajero” Hatchery Camarines Sur Manila Pangasinan Baguio (frozen) (frozen) Supermarket
Product Flow (Pampanga – Pangasinan - Baguio Route) Local market Baguio Marketable size (live) Grow-out pond Pampanga Trader (live) Ilocos Central fish market Dagupan Isabela FRY/FINGERLINGS - Direct stocking Hatchery/ Nursery Pampanga (live) Supermarket Pampanga Manila Consolidator/Trader
Information Flow Hatchery Specialty Shop Processor • FRY • Volume • Delivery schedule • Size • Strain/Sex • -Source of fish • -Volume • Delivery schedule • Size Supermarket Local market Nursery • MARKETABLE SIZE • -Volume • Delivery schedule • Size • Price • FINGERLINGS • Quantity • Delivery schedule • Cost • Strain/Sex Wholesaler-Retailer Trader /Consolidator Wholesaler /”Viajero” Producers • MARKETABLE SIZE • -Volume • Price • Weight • Quality
Payment Flow Advanced cash Hatchery Specialty Shop Processor CASH CASH Supermarket Nursery Post-dated checks,7 days CASH CASH Wholesaler-Retailer Terminal Market Trader/Consolidator Wholesaler/”Viajero” CASH Producers Cash, net after feed loan (1-2 days) Sales remittances, net after trading capital Cash CASH Cash Trader/Retailer (small-scale) Local market Retailer Producers (non feed-borrowers) CASH Cash after sales collection
Transaction Costs Major Concerns HATCHERIES/ NURSERIES HATCHERIES/ NURSERIES FISH FARMERS • Expensive inputs • Mislabeld inputs • In-transit mortality losses • Toll fees (“goodwill”) • High cost of outbound logistics FISH FARMERS • Low fish recovery • 25% in lakes and cages/pens • 60% in pond systems • High competition with mixed sex fingerlings • 4% shrinkage allowance required by traders • Overstocking • High mortality rates • Unpredictable climate patterns • Cost of waiting • Harvest delays • Prolonged grow-out period (8-10 months ) • Limited opportunities for value-adding & processing • Lack of cold storage facilities
Transaction Costs Major Concerns TRADERS TRADERS • high logistics and transaction costs of • Search • Assembly • Distribution • “Uncalibrated” weighing scale of fish farmers • Disrupted delivery schedules due to defaulting “contract growers” • Lag responses to price changes • Absence of product grades and standards
Transaction Costs Major Concerns PROCESSORS PROCESSORS • Insufficient supply of raw materials • Lack of blast freezers and other equipment • Presence of inexpensive substitutes (e.g. pangasius, sea bass and others) • High cost of filleting • Low dressing recovery • High opportunity costs due to untapped markets
Transaction Costs Major Concerns INSTITUTIONAL BUYERS INSTITUTIONAL BUYERS • Off-season stock-outs from regular suppliers • High cost of product search • High opportunity cost
Recommendations • Encourage the establishment of more nursery and hatchery farms • Conduct market promotion • Motivate participation of small farmers in supply chains • Institutionalize an accreditation/certification program for feed manufacturers, hatcheries and processors • Strengthen farmers’ organizations
Funding for this research was provided by theCOLLABORATIVE RESEARCH SUPPORT PROGRAM The AquaFish CRSP is funded in part by United States Agency for International Development (USAID) Cooperative Agreement No. EPP-A-00-06-00012-00 and by US and Host Country partners. The contents of this presentation do not necessarily represent an official position or policy of the United States Agency for International Development (USAID). Mention of trade names or commercial products in this presentation does not constitute endorsement or recommendation for use on the part of USAID or the AquaFish Collaborative Research Support Program. The accuracy, reliability, and originality of the work presented are the responsibility of the individual authors.