Download
1 / 36
360 likes | 378 Views
Prof. Fred S. Singer University of Virginia, USA Physics of global warming. Figure 2. Temperature Deviation ( C). Year. Figure 3.6. Figure 2.22. CCSP 1.1 – Chapter 1, Figure 1.3F PCM Simulations of Zonal-Mean Atmospheric Temperature Change. CCSP 1.1 – Chapter 5, Figure 7E.

E N D
Prof. Fred S. Singer University of Virginia, USA Physics of global warming
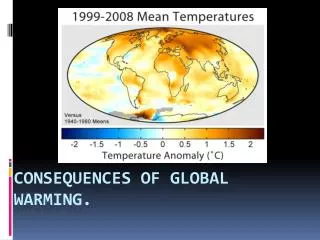
Figure 2 Temperature Deviation (C) Year
CCSP 1.1 – Chapter 1, Figure 1.3F PCM Simulations of Zonal-Mean Atmospheric Temperature Change
A more detailed view of the disparity: Douglass, Knox, Pearson, Singer GRL-2006
NUMBERS OF WEATHER STATIONS AND GRID BOXES Weather Stations: Northern/Southern. Grid Boxes Northern/Southern (Possible 25992 for 5º x 5º)
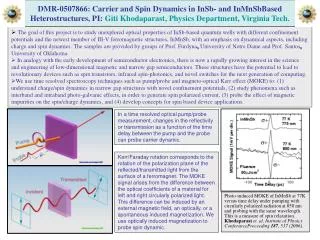
As this cartoon illustrates, with a dry upper troposphere, WV will radiate at the higher temperature (upper blue) of the boundary layer instead of the lower temperature of the UT (lower blue) – thereby increasing OLR (outgoing long-wave radiation). This is balanced by less IR emission from the surface in the atmospheric window (lower red), hence a cooler surface. OLR 10 20 Wave Length [microns]
Sea Level Rise to 2100 H R S
SUN IR T + dT BUOY Engine Inlet SHIP
CCSP 1.1 - Executive Summary Figure 4G: Modeled and Observed Temperature Trends in the Tropics (20oS-20oN)
El Niño Volcanoes El Chichon Pinatubo