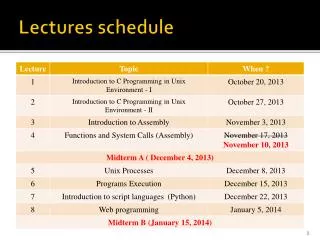
Lectures ( Biostatistics)
Lectures ( Biostatistics). DAVID NANA ADJEI JAMES KWAKU AGYEN UHAS. Module 1. Introduction To Biostatistics I've come loaded with statistics, for I've noticed that a man can't prove anything without statistics. No man can. . Descriptive Statistics. 1 Overview


Lectures ( Biostatistics)
E N D
Presentation Transcript
Lectures (Biostatistics) DAVID NANA ADJEI JAMES KWAKU AGYEN UHAS
Module 1 Introduction To Biostatistics I've come loaded with statistics, for I've noticed that a man can't prove anything without statistics. No man can. DNA/JKA
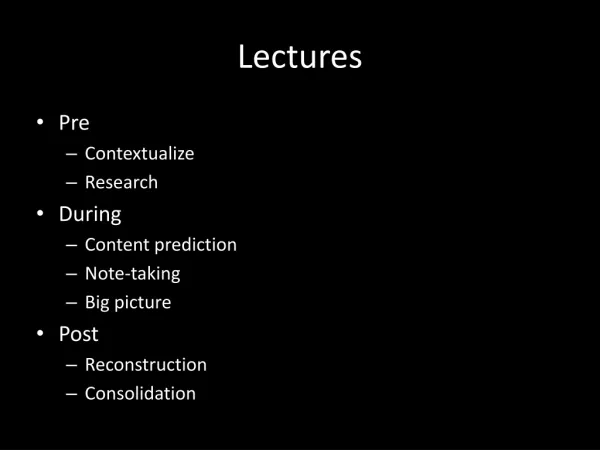
Descriptive Statistics 1 Overview 2 Summarizing Data with Frequency Tables 3 Pictures of Data 4 Measures of Center 5 Measures of Variation 6 Measures of Position 7 Exploratory Data Analysis (EDA) DNA/JKA
Key words : • Statistics , data , Biostatistics, • Variable ,Population ,Sample DNA/JKA
IntroductionSome Basic concepts Statistics is a field of study concerned with 1-collection, organization, summarization and analysis of data. 2- drawing of inferences about a body of data when only a part of the data is observed. Statisticians try to interpret and communicate the results to others. DNA/JKA
* Biostatistics: The tools of statistics are employed in many fields: business, education, psychology, agriculture, economics, … etc. When the data analyzed are derived from the biological science and medicine, we use the term biostatistics to distinguish this particular application of statistical tools and concepts. DNA/JKA
Role of statisticians To guide the design of an experiment or survey prior to data collectionTo analyze data using proper statistical procedures and techniquesTo present and interpret the results to researchers and other decision makers DNA/JKA
Data: • The raw material of Statistics is data. • We may define data as figures. Figures result from the process of counting or from taking a measurement. • For example: • - When a hospital administrator counts the number of patients (counting). • - When a nurse weighs a patient (measurement) DNA/JKA
* Sources of Data: We search for suitable data to serve as the raw material for our investigation. Such data are available from one or more of the following sources: 1-Routinely kept records. For example: - Hospital medical records contain immense amounts of information on patients. • Hospital accounting records contain a wealth of data on the facility’s business • activities. DNA/JKA
2- External sources. The data needed to answer a question may already exist in the form of published reports, commercially available data banks, or the research literature, i.e. someone else has already asked the same question. DNA/JKA
3- Surveys: The source may be a survey, if the data needed is about answering certain questions. For example: If the administrator of a clinic wishes to obtain information regarding the mode of transportation used by patients to visit the clinic, then a survey may be conducted among patients to obtain this information. DNA/JKA
4- Experiments. Frequently the data needed to answer a question are available only as the result of an experiment. For example: If a nurse wishes to know which of several strategies is best for maximizing patient compliance, she might conduct an experiment in which the different strategies of motivating compliance are tried with different patients. DNA/JKA
* A variable: It is a characteristic that takes on different values in different persons, places, or things. For example: - heart rate, - the heights of adult males, - the weights of preschool children, - the ages of patients seen in a dental clinic. DNA/JKA
Types of data Constant Variables DNA/JKA
Important Characteristics of Data 1. Center: A representative or average value that indicates where the middle of the data set is located 2. Variation: A measure of the amount that the values vary among themselves 3. Distribution: The nature or shape of the distribution of data (such as bell-shaped, uniform, or skewed) 4. Outliers: Sample values that lie very far away from the vast majority of other sample values 5. Time: Changing characteristics of the data over time DNA/JKA
Types of variables Quantitative variables Qualitative variables Quantitative continuous Qualitative nominal Quantitative descrete Qualitative ordinal DNA/JKA
Quantitative Variables It can be measured in the usual sense. For example: - the heights of adult males, - the weights of preschool children, the ages of patients seen in a dental clinic. Qualitative Variables Many characteristics are not capable of being measured. Some of them can be ordered or ranked. For example: - classification of people into socio-economic groups, - social classes based on income, education, etc. DNA/JKA
A discrete variable is characterized by gaps or interruptions in the values that it can assume. For example: - The number of daily admissions to a general hospital, The number of decayed, missing or filled teeth per child in an elementary school. A continuous variable can assume any value within a specified relevant interval of values assumed by the variable. For example: Height, weight, skull circumference. No matter how close together the observed heights of two people, we can find another person whose height falls somewhere in between. DNA/JKA
* A population: It is the largest collection of values of a random variable for which we have an interest at a particular time. For example: The weights of all the students enrolled in SAHS. Populations may be finite or infinite. DNA/JKA
* A sample: It is a part of a population. For example: The weights of only a fraction (Public Health Students) of SAHS. DNA/JKA
LEVELS OF MEASUREMENT • nominal level of measurement characterized by data that consist of names, labels, or categories only. The data cannot be arranged in an ordering scheme (such as low to high) Example: survey responses yes, no, undecided DNA/JKA
Definitions • ordinal level of measurement involves data that may be arranged in some order, but differences between data values either cannot be determined or are meaningless Example: Course grades A, B, C, D, or F DNA/JKA
Definitions • interval level of measurement like the ordinal level, with the additional property that the difference between any two data values is meaningful. However, there is no natural zero starting point (where none of the quantity is present) Example: Years 1000, 2000, 1776, and 1492 DNA/JKA
Definitions • ratio level of measurement the interval level modified to include the natural zero starting point (where zero indicates that none of the quantity is present). For values at this level, differences and ratios are meaningful. Example: Weights of students in level 100 DNA/JKA
Levels of Measurement • Nominal- categories only • Ordinal- categories with some order • Interval- differences but no natural starting point • Ratio- differences and a natural starting point DNA/JKA
Excercises DNA/JKA
Chapter ( 2 ) Strategies for understanding the meanings of Data
He uses statistics as a drunken man uses lamp posts - for support rather than for illumination. Say you were standing with one foot in the oven and one foot in an ice bucket. According to the percentage people, you should be perfectly comfortable. ~Bobby Bragan, 1963 DNA/JKA
Key words frequency table, bar chart ,range width of interval ,mid-interval Histogram , Polygon DNA/JKA
Descriptive StatisticsFrequency Distribution for Discrete Random Variables Example: Suppose that we take a sample of size 16 from children in a primary school and get the following data about the number of their decayed teeth, 3,5,2,4,0,1,3,5,2,3,2,3,3,2,4,1 To construct a frequencytable: 1- Order the values from the smallest to the largest. 0,1,1,2,2,2,2,3,3,3,3,3,4,4,5,5 2- Count how many numbers are the same.
Representing the simple frequency table using the bar chart We can represent the above simple frequency table using the bar chart. DNA/JKA
2.3 Frequency Distribution for Continuous Random Variables For large samples, we can’t use the simple frequency table to represent the data. We need to divide the data into groups or intervals or classes. So, we need to determine: 1- The number of intervals (k). Too few intervals are not good because information will be lost. Too many intervals are not helpful to summarize the data. A commonly followed rule is that 6 ≤ k ≤ 15, or the following formula may be used, k = 1 + 3.322 (log n) DNA/JKA
2- The range (R). It is the difference between the largest (max) and the smallest (min) observation in the data set. 3- The Width of the interval (w). Classintervals generally should be of the same width. Thus, if we want k intervals, then w is chosen such that w ≥ R / k. DNA/JKA
Example: Assume that the number of observations equal 100, then k = 1+3.322(log 100) = 1 + 3.3222 (2) = 7.6 8. Assume that the smallest value = 5 and the largest one of the data = 61, then R = 61 – 5 = 56 and w = 56 / 8 = 7. To make the summarization more comprehensible, the class width may be 5 or 10 or the multiples of 10. DNA/JKA
Example 2.3.1 • We wish to know how many class interval to have in the frequency distribution of the data of ages of 169 subjects who Participated in a study on smoking cessation. Note: Max=82 and Min=30 • Solution : • Since the number of observations equal 189, then • k = 1+3.322(log 169) • = 1 + 3.3222 (2.276) 9, • R = 82 – 30 = 52 and • w = 52 / 9 = 5.778 • It is better to let w = 10, then the intervals • will be in the form: DNA/JKA
Frequency Distribution Table Sum of frequency =sample size=n DNA/JKA
The Cumulative Frequency: It can be computed by adding successive frequencies. The Cumulative Relative Frequency: It can be computed by adding successive relative frequencies. TheMid-interval: It can be computed by adding the lower bound of the interval plus the upper bound of it and then divide over 2. DNA/JKA
For the above example, the following table represents the cumulative frequency, the relative frequency, the cumulative relative frequency and the mid-interval. R.f= freq/n DNA/JKA
Example : • From the above frequency table, complete the table then answer the following questions: • 1-The number of objects with age less than 50 years ? • 2-The number of objects with age between 40-69 years ? • 3-Relative frequency of objects with age between 70-79 years ? • 4-Relative frequency of objects with age more than 69 years ? • 5-The percentage of objects with age between 40-49 years ? DNA/JKA
6-The percentage of objects with age less than 60 years ? • 7-The Range (R) ? • 8- Number of intervals (K)? • 9- The width of the interval ( W) ? DNA/JKA
Representing the grouped frequency table using the histogram To draw the histogram, the true classes limits should be used. They can be computed by subtracting 0.5 from the lower limit and adding 0.5 to the upper limit for each interval. DNA/JKA
Representing the grouped frequency table using the Polygon DNA/JKA
Exercises DNA/JKA
Section (2.4) : Descriptive Statistics Measures of Central Tendency
The statistics on sanity are that one out of every four Ghanaians is suffering from some form of mental illness. Think of your three best friends. If they're okay, then it's you.
key words: Descriptive Statistic, measure of central tendency ,statistic, parameter, mean (μ) ,median, mode. DNA/JKA
The Statistic and The Parameter • A Statistic: It is a descriptive measure computed from the data of a sample. • A Parameter: It is aa descriptive measure computed from the data of a population. Since it is difficult to measure a parameter from the population, a sample is drawn of size n, whose values are 1 , 2 , …, n. From this data, we measure the statistic. DNA/JKA
What to describe? • What is the “location” or “center” of the data? (“measures of location”) • How do the data vary? (“measures of variability”) DNA/JKA
Measures of Central Tendency A measure of central tendency is a measure which indicates where the middle of the data is. The three most commonly used measures of central tendency are: The Mean, the Median, and the Mode. The Mean: It is the average of the data. DNA/JKA