Download
1 / 19
210 likes | 638 Views
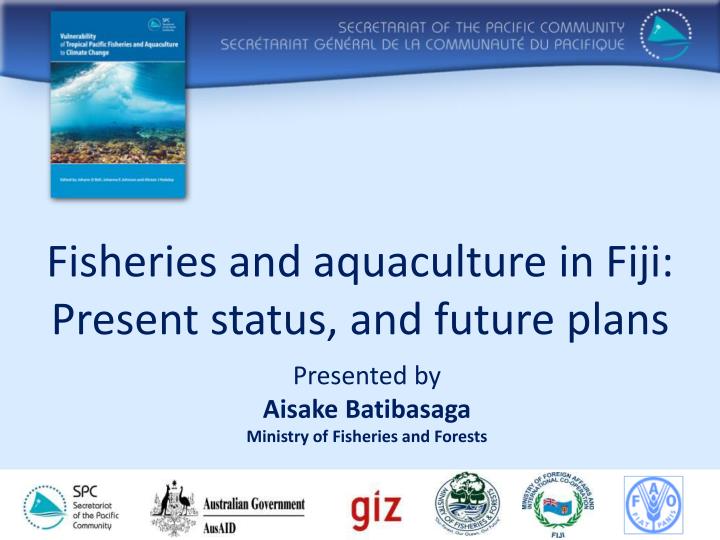
Fisheries and aquaculture in Fiji: Present status, and future plans. Presented by Aisake Batibasaga Ministry of Fisheries and Forests. OVERVIEW OF FISHERIES SECTOR – GDP VALUE ($M). FISHERIES SECTOR - OFFSHORE. OFFSHORE Target species – Tuna (ALB, YFT, BET), Deepwater Snapper

E N D
Fisheries and aquaculture in Fiji: Present status, and future plans Presented by Aisake Batibasaga Ministry of Fisheries and Forests
FISHERIES SECTOR - OFFSHORE OFFSHORE Target species – Tuna (ALB, YFT, BET), Deepwater Snapper Total Allowable Catch:15,000 mt Actual catches : 13,850 mt Value: USD 67 million PROCESSING • processors – 6 • cannery – 2 • domestic fleet -132 • employs : 1650 people
Inshore Fisheries Importance: Food security Protein and micro-nutrient uptake Subsistence Livelihoods and income generation
Subsistence catch 21,600mt per year (Gillett and Lightfoot, 2001). 2008 Monte Carlo Model estimates: 18,186mt per year (fish & invertebrates) 15,400 mt finfish No. of fishers: 25,700 Subsistence catch Value: USD 31 m Finfish: USD 21.3 m Invertebrates USD 9.7 m
Artisanal (Commercial) Fisheries Catch Finfish – 5,500 mt (US $25.2 m) Invertebrate: 1,200 mt (US $ 6.5 m) No. of Fishers: 22,650. Reef-associated species dominate 85% of total catch ~100 reef fish species 30 species - invertebrates
Beche-de-mer Markets High international demand High retail value: US$ 650 kg (HK) Price to fishers: $ FJ25- $11O kg Export value: FJ $21 mil in 2011. Exports fluctuate Management issues Minimal monitoring and enforcement Increased use of boats Use of SCUBA and hookah. Target other marine resources
Aquarium Trade Value @ over FD 25m Hard & soft corals Live rock (unsustainable, CITES quota) Aquarium fish
SPAWNING AGGREGATIONS • Most reef fish aggregate to spawn • Critical for fish stock replenishment x x x Tilagica passage 2005
Inshore fisheries challenges • Resource depletion • Degraded habitats - reduce fisheries productivity • Increased demand - overfishing • Better management • More comprehensive MP • Institute EAFM • Basic data for indicators
Inshore fisheries Initiatives • Management committees • Implement actions at community and national level • Marine protected area networks • Locally managed marine areas are the focus • Assess benefits and efficacy using indicator species • Participation of communities in data collection • Customary Marine Tenure and CBM • Integrating local and national governance
FRESHWATER RESOURCES Kai Fishery • 2600-3000 mt = 60-70% of total fw catch • Mainly women • 3 major rivers: Ba, Sigatoka & Rewa. • Important for rural economy & food security Fresh water prawns Catch: ~10 mt Declines in harvest due to forest clearing and use of chemicals
Aquaculture Commodities for livelihoods • Black pearls • Seaweed • Freshwater prawn • Mud crab • Giant clam Commodities for food security • Tilapia • Milkfish
AQUACULTURE PRODUCTION Livelihoods in aquaculture: 550
KEY FEATURES OF THE SECTOR Fish consumption • 42 kg per person per year (national) • 120 kg person per year (rural & islands) Total finfish production • 45,000 mt = 30.8 % Offshore, 68.5 % Inshore, 0.7 % Aquaculture Areas • Territorial Sea : 45,000 sq.km • Archipelagic waters: 130, 400 sq. km • Exclusive Economic Zone : 1,093,600 sq.km • Total No. of i-Qoliqoli: 411 (31,000 sq.km)
PLANS FOR THE FUTURE • Maintain or increase sector contribution to 3% of GDP, • Cap inshore fisheries production at current levels • Maintain tuna catches and improve proportion processed locally • Aquaculture only potential area of expansion ?? – not being realized !
Plans for the futurE • Improve management plans for all sectors • Strengthen research capacity to assess the status of the resources • Strengthen policy & economic planning framework • Incorporate EAFM – ‘ridge to reef’ management
CONCLUDING REMARKS Need to implement management plans to : • Improve capacity to manage the fisheries sectors • Form stronger alliances/ partnerships to move management and conservation goals forward. • Assess the effects of drivers on the sector, including climate change ‘How could climate change affect our plans?’
THANK YOU VINAKA