Download

1 / 23
240 likes | 383 Views
Population Dynamics - History Demographic Transition In recent years death rates in many developing nations have decreased Status of the social and economic changes that will supposedly lead to stable populations is unclear

E N D
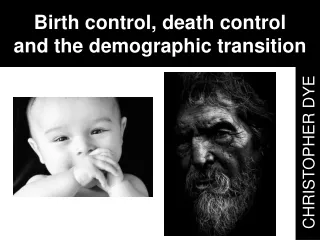
Population Dynamics - History • Demographic Transition • In recent years death rates in many developing nations have decreased • Status of the social and economic changes that will supposedly lead to stable populations is unclear • Some neo-Malthusians pessimistic that transition to lower birth rates and stable populations will occur • Garrett Hardin - “Lifeboat Ethics” • Barry Commoner - Anti-Malthusian • Main cause of environmental degradation is inappropriate use of technology, not simple population growth • Ecologically sound development more important than population control
Population Dynamics - Theory • Background • Understanding human population dynamics requires understanding population theory • Earth is a closed system (no immigration/emigration) • Population size is dynamic equilibrium between • Biotic potential • Per-capita growth rate (r) • r = b - d (per-capita birth rate - death rate) • r > 0 population growing • r < 0 population shrinking • r = 0 ZPG
Population Dynamics - Theory • Background • Instantaneous growth rate of a population may be represented by dN/dt = rN • dN/dt - Change in population size over time • r - Per-capita growth rate • N - Population size • Two basic growth models • Density-independent growth • Density-dependent growth
Population Dynamics - Theory • Density-Independent Growth • Population growth with unlimited resources • In nature, usually occurs rarely and briefly • Limited by maximum per-capita growth rate for a species (rmax) • rmax inversely related to generation time • Ex - Higher for mouse than human • Population growth rate described by • dN/dt = rmaxN • Exponential growth
Population Dynamics - Theory • Density-Independent Growth • Not sustainable indefinitely in the real world • Assumes/Requires unlimited resources • Increasing population density limits ability of individuals to acquire resources • Density affects/limits population growth rate
Population Dynamics - Theory • Density-Dependent Growth • Based on idea that a given environment only can support a limited number of individuals • Carrying capacity (K) • Population growth described by logistic growth model • dN/dt = rmaxN (1-N/K) • Environmental resistance (N/K) increases as N increases
Population Dynamics - Trends • Demographics • Global population reached 6 billion in Oct 1999 and 7 billion in Oct 2011 • Most population growth currently taking place in developing nations • Developing nations contain 80% of global population • Percentage of global population growth in developing nations • 1950 – 85% • Today – 99%
Population Dynamics - Trends • Total Fertility Rate (TFR) • TFR = Fecundity • 2.0 = Replacement level fertility • Global TFR • 1950 – 5.0 • 2010 – 2.45 (51% decrease) • Africa – 4.37 (Niger – 7.19, Somalia – 6.40) • Asia – 2.18 (India – 2.73, China – 1.64) • N America – 2.04 (Canada – 1.65, Mexico – 2.41, USA – 2.07) • Europe – 1.59 (Bosnia – 1.18, Germany – 1.36) • PRB Map Source: UN Population Division
UN Population Division Roberts 2011
Population Dynamics - Trends • Infant Mortality Rate (IMR) • Global IMR • 1950 – 156 deaths per 1000 births (15.6%) • 2010 – 43 deaths per 1000 births (4.30%) • 72.4% decrease • Europe – 0.7% • Africa – 7.50% Source: UN Population Division
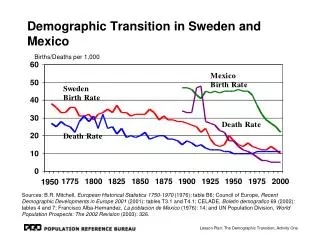
Population Dynamics - Trends • Birth and Death Rates • 1950 • Birth rate – 37 per 1000 people per year • Death rate – 20 per 1000 people per year • Growth = 17 per 1000 people per year = 1.7% • 2010 • Birth rate – 19.4 per 1000 people per year • Death rate – 8.3 per 1000 people per year • Growth = 11.1 per 1000 people per year = 1.11% • Developed nations – 0.23% (0.07 B-D + 0.16 I) • Developing nations – 1.28% (1.33 B-D – 0.05 E) Source: UN Population Division
Population Dynamics - Trends • Age and Life Expectancy • Median Age • World – 29.4 years (2011) • Developed nations – 39.7 years • Europe – 40.2 years • N. America – 36.9 years • Developing nations – 26.8 years • Africa – 19.7 years • Life Expectancy • 1950 – 46 years • 2010 – 68.9 years • Africa – 56.0 years (Swaziland – 48.7 years) • Europe – 76.1 years (Andorra – 83.5 years) Source: UN Population Division
Population Dynamics - Trends • Population Projections - UN • Low Variant (TFR: 2.45 1.55 by 2100) • 2050 – 8.1 billion, 2100 – 6.2 billion • Medium Variant (TFR: 2.45 2.03) • 2050 – 9.3 billion, 2100 – 10.1 billion • High Variant (TFR: 2.45 2.51) • 2050 – 10.6 billion, 2100 – 15.8 billion • Constant Variant (TFR = 2.45 4.44) • 2050 – 10.9 billion, 2100 – 26.8 billion