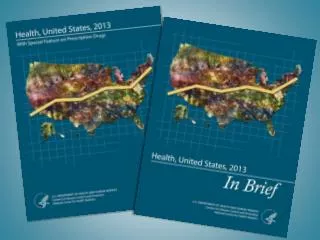
Health in the United States 2015: Life Expectancy, Disease Rates, and Healthcare Access
290 likes | 310 Views
This report provides insights into the health status of the United States, including life expectancy, disease rates, healthcare access, and insurance coverage. Data from reliable sources such as CDC/NCHS and NHIS are used.

Health in the United States 2015: Life Expectancy, Disease Rates, and Healthcare Access
E N D
Presentation Transcript
Life expectancy at birth, OECD countries, 2013 NOTES: Countries with estimated life expectancies or series breaks for 2013 are not presented. Differences in life expectancy may reflect differences in reporting methods, which can vary by country, in addition to actual differences in mortality rates. SOURCE: CDC/NCHS, Health, United States, 2015, Figure 1 and Tables 14 and 15. Data from the National Vital Statistics System (NVSS) and the Organisation for Economic Co-operation and Development (OECD).
Selected causes of death NOTES: CLRD is chronic lower respiratory diseases. A change in the coding rules for nephritis, nephrotic syndrome and nephrosis caused an increase in the number of deaths attributed to diabetes beginning with 2011 data. Thus, the trend for diabetes death rates should be interpreted with caution. SOURCE: CDC/NCHS, Health, United States, 2015, Figure 2 and Table 17. Data from the National Vital Statistics System (NVSS).
Suicide and homicide death rates, 2014 SOURCE: CDC/NCHS, Health, United States, 2015, Figure 3 and Tables 29 and 30. Data from the National Vital Statistics System (NVSS).
Teenage childbearing SOURCE: CDC/NCHS, Health, United States, 2015, Figure 4 and Table 3. Data from the National Vital Statistics System (NVSS).
Notifiable disease rates NOTES: Diseases with consistent definitions and the greatest changes between 2003 and 2013 were selected for display. Rates used the postcensal total resident population. SOURCE: CDC/NCHS, Health, United States, 2015, Figure 5 and Table 33. Data from the National Notifiable Diseases Surveillance System (NNDSS).
Disability indicators, 2014 SOURCE: CDC/NCHS, Health, United States, 2015, Figure 6. Data from the National Health Interview Survey (NHIS).
Current cigarette smoking NOTE: Smoked 100 cigarettes in their lifetime and smokes now every day or some days. SOURCE: CDC/NCHS, Health, United States, 2015, Figure 7 and Table 47. Data from the National Health Interview Survey (NHIS).
Children and adolescents with obesity NOTE: Obesity is body mass index (BMI) at or above the sex- and age-specific 95th percentile BMI cutoff points from the 2000 CDC Growth Charts. SOURCE: CDC/NCHS, Health, United States, 2015, Figure 8 and Table 59. Data from the National Health and Nutrition Examination Survey (NHANES).
Adults with overweight and obesity: Aged 20+ NOTES: BMI is body mass index. Overweight but not obese (25 ≤ BMI < 30); Grade 1 obesity (30 ≤ BMI < 35); Grade 2 obesity (35 ≤ BMI < 40); Grade 3 obesity (BMI ≥ 40). SOURCE: CDC/NCHS, Health, United States, 2015, Figure 9 and Table 58. Data from the National Health and Nutrition Examination Survey (NHANES).
Pap test utilization NOTE: Pap tests (Pap smears) may be used for screening or diagnostic purposes; the purpose cannot be determined from NHIS. SOURCE: CDC/NCHS, Health, United States, 2015, Figure 10 and Table 71. Data from the National Health Interview Survey (NHIS).
Emergency department use:Adults aged 18–64 SOURCE: CDC/NCHS, Health, United States, 2015, Figure 11 and Table 74. Data from the National Health Interview Survey (NHIS).
Difficulty accessing care:Adults aged 18–64 SOURCE: CDC/NCHS, Health, United States, 2015, Figure 12 and Table 63. Data from the National Health Interview Survey (NHIS).
Electronic health record components SOURCE: CDC/NCHS, Health, United States, 2015, Figure 13. Data from the National Ambulatory Medical Care Survey (NAMCS)—National Electronic Health Records Survey.
Physicians accepting new patients, 2013 NOTE: Physicians are office-based. SOURCE: CDC/NCHS, Health, United States, 2015, Figure 14. Data from the National Ambulatory Medical Care Survey (NAMCS)—National Electronic Health Records Survey.
Personal health care expenditures NOTE: Personal health care expenditures are outlays directly related to patient care. SOURCE: CDC/NCHS, Health, United States, 2015, Figure 15 and Table 95. Data from the Centers for Medicare & Medicaid Services, National Health Expenditure Accounts (NHEA).
Health insurance coverage: Adults aged 18–64 NOTE: Preliminary estimates for the first 6 months of 2015 are shown with a dashed line. SOURCE: CDC/NCHS, Health, United States, 2015, Figure 16 and Tables 102, 104, and 105. Data from the National Health Interview Survey (NHIS).
Health insurance coverage: Adults aged 18–64 NOTE: States were classified based on their decision to expand Medicaid as of January 1, 2014. SOURCE: CDC/NCHS, Health, United States, 2015, Figure 17. Data from the National Health Interview Survey (NHIS).
Life expectancy at birth NOTE: Life expectancy data by Hispanic origin were available starting in 2006 and were corrected to address racial and ethnic misclassification. SOURCE: CDC/NCHS, Health, United States, 2015, Figure 18. Data from the National Vital Statistics System (NVSS).
Infant mortality rates SOURCE: CDC/NCHS, Health, United States, 2014, Figure 19. Data from the National Vital Statistics System (NVSS).
Preterm births, 2014 NOTES: Preterm births are based on the obstetric estimate of gestational age and are for all singleton births. SOURCE: CDC/NCHS, Health, United States, 2015, Figure 20. Data from the National Vital Statistics System (NVSS).
Low-risk cesarean delivery NOTES: Low-risk cesarean deliveries are for full term (37 or more completed weeks of gestation), singleton, vertex (head first) births to women giving birth for the first time. The term low-risk cesarean delivery is not meant to imply that a cesarean delivery may not be medically necessary for low-risk women. SOURCE: CDC/NCHS, Health, United States, 2015, Figure 21. Data from the National Vital Statistics System (NVSS).
Children with obesity, 2011–2014 NOTE: Obesity is defined as a body mass index at or above the sex- and age-specific 95th percentile of the CDC growth charts. SOURCE: CDC/NCHS, Health, United States, 2015, Figure 22. Data from the National Health and Nutrition Examination Survey (NHANES).
Adults with hypertension: Adults aged 20+ NOTE: Estimates are age-adjusted. Hypertension is having measured high blood pressure (systolic pressure of at least 140 mm Hg or diastolicpressure of at least 90 mm Hg) and/or respondent report of taking antihypertensive medication. SOURCE: CDC/NCHS, Health, United States, 2015, Figure 23. Data from the National Health and Nutrition Examination Survey (NHANES).
Current cigarette smoking:Adults aged 18+ NOTES: Estimates are age-adjusted. Smoked 100 cigarettes in their lifetime and smokes now every day or some days. SOURCE: CDC/NCHS, Health, United States, 2015, Figure 24. Data from the National Health Interview Survey (NHIS).
Influenza vaccination:Adults aged 18+ SOURCE: CDC/NCHS, Health, United States, 2015, Figure 25. Data from the National Health Interview Survey (NHIS).
Uninsured: Adults aged 18–64 NOTE: Preliminary estimates for the first 6 months of 2015 are shown with a dashed line. SOURCE: CDC/NCHS, Health, United States, 2015, Figure 26. Data from the National Health Interview Survey (NHIS).
Difficulty accessing care:Adults aged 18–64 SOURCE: CDC/NCHS, Health, United States, 2015, Figure 27. Data from the National Health Interview Survey (NHIS).