Download
1 / 37
450 likes | 884 Views
Public Perceptions of Causes of Childhood Obesity. Parental responsibility Modern technology and media Over-consumption of unhealthy foods Children’s lack of knowledge and motivation Physical activity environment Lack of healthy food Lack of physical activity Genes.

E N D
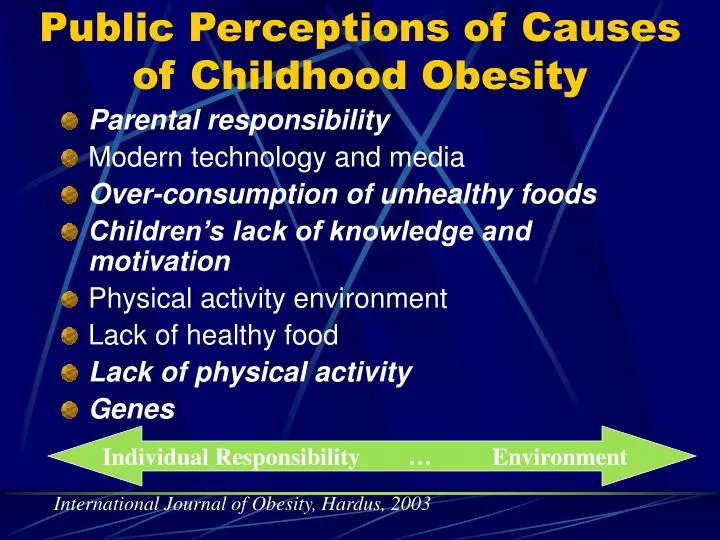
Public Perceptions of Causes of Childhood Obesity • Parental responsibility • Modern technology and media • Over-consumption of unhealthy foods • Children’s lack of knowledge and motivation • Physical activity environment • Lack of healthy food • Lack of physical activity • Genes Individual Responsibility … Environment International Journal of Obesity, Hardus, 2003
Individual Choice/Environment Recommended Sugar Max = 45g Recommended Fat Max = 60g 278 g 85 g
SocioEcological Web and Childhood Obesity Public Policy Factors FDA-labels Community Factors School foods Institutional Factors advertising Families Interpersonal Factors School Individual Restaurants Supermarkets Dynamic links PA opportunities
SocioEcological Web Influencing Childhood Obesity • Individual (individual choice & responsibility) • Dietary intake, physical activity, sedentary behavior • Influenced by knowledge,attitudes, beliefs, skills • Interpersonal • Families, friends, peers • Provide social identity, support and role definition • Institutional • Schools, local sporting institutions • Rules, regulations, policies that constrain or encourage particular behaviors
SocioEcological Web Influencing Childhood Obesity Families • Community • Formal or informal local networks and norms • Resources that encourage or discourage healthy eating and physical activity • Public Policy • Local, state and federal policies or laws that regulate or effect eating practices and exercise habits
Families • Powerful and complex fields of influence embedded in a multi-layered environment • Characteristics • Foods available at home • Food/meal routines – feeding styles • Family members’ weight status and diet • Attitudes towards weight individuals’ weight status • Encouragement of physical activity • Rules regarding TV use
Families, continued • Changes in home environment • Increased use of fast foods and home replacement meals (1987-2.6 billion sales; 1992 –5.7 billion sales) • 1965 – 30% of food $ spent away from home; 1998 increased to 47% (Bowers, D.E., Food Review January-April 2000:23-29, Jekanowski, M.D. Food Review January-April 1999:32-34, Jekanowksi, M.D., Food Review January-April 1999:11-16)
Parent-Child Eating Styles • Parents shape children’s eating style • Foods available • Parent feeding styles • restriction of intake (restrict child’s access to unhealthy foods) • pressure to eat (pressure child to eat more food, typically healthy foods) • Mothers report > use of restrictive practices • With increased mothers’ own weight/eating concerns • With increased perception of daughters’ risk for weight problem • Mothers report > use of pressure to eat • With increased perception of daughter as underweight Francis, Appetite, 2001
Potential Adverse Effects • Result is to focus child away from internal cues regarding hunger and satiety • Parent assumes responsibility of initiating or terminating eating • Potential to compromise child internal awareness of hunger/fullness and appropriate responses • Limitations – white well educated sample of mothers and 5 yo daughters (n=196 Francis, Appetite, 2001
Long Term Effects of Parental Restrictive Feeding Styles • Assessment of 5-7 yo girls intake of palatable foods after a standardized lunch • Girls with large intakes of snack foods in the absence of hunger were 4.6 times more likely to be overweight at 5 and 7 years of age • For each unit of increase in parents’ reported restrictive feeding styles at 5 y, girls were 2.1 times as likely to eat in absence of hunger at age 7 (even after controlling for BMI and hunger related eating at age 5) • About 50% girls reported negative self evaluation after eating; such report linked to perceptions of being restricted from such foods Fisher, American Journal of Clinical Nutrition, 2002
Attitudes, Practices & Concerns Re: Child Feeding and Weight • Need to tailor interventions based on attitudes, practices and concerns • Build on mothers goals to provide good nutrition while balancing convenience, variety and cost • Provide strategies to overcome stress associated with providing meals • Focus parents on encouraging child-based hunger/fullness cues and appropriate responses • Recognize differences in cultural perceptions of overweight and facilitate recognition of unhealthy weights Sherry, JADA, 2004
Parent’s Perceptions Re: Children’s Weight • 3 focus groups (n=18; 13 black, 5 white); WIC participants • Mothers don’t use reported anthropometrics to assess weight, instead use reported teasing and limitations on exercise; if active with good appetite not considered overweight; overweight children described as “thick or solid”; genes considered cause independent of environment; emotionally difficult to deny or limit foods
Parent’s Perceptions Re: Children’s Weight • Cross sectional survey of 622 WIC participants with children 2-5 years • 45% low education (30% moms obese; 19% children overweight) • 55% high education (17% moms obese; 14% children overweight) • 79% of mothers failed to perceive overweight children as overweight; almost all accurately perceive their own weight • Among 99 moms with overweight children, low maternal education associated with misperception after controlling for income, maternal obesity, age, smoking and child’s age, race and gender Baughcum, Pediatrics, 2000
Media – Influences Families • Conflicting messages • Healthy-weight children shown in advertisements • negative stereotypes of overweight children among many segments of the population – including health care professionals • Unhealthy, academically unsuccessful, socially inept, unhygienic and lazy (Hill, Int J Obesity 1995, Teachman, Int J Obesity 2001) • Promotion/Advertisement of energy dense foods in all venues (TV, schools, community sites, Internet
Calories 110 Fat 2 g Sugar 1 g Fiber 3 g Calories 110 Fat 1 g Sugar 6 g Fiber 3 g Calories 120 Fat 1 g Sugar 14 g Fiber 0 g Are Cocoa Puffs really part of a healthy breakfast?
Media Literacy Activities • 35 parents with children participating in Head Start programs; 4 week media literacy program (compared to 4 week food safety educational placebo to control for “attention”); pre-post evaluation • 4 week curriculum: advertising techniques, children’s perceptions of ads, comparing food label information to claims, role playing dealing with children’s requests • Improved parents’ understanding of TV advertising (p<.001), attitudes about TV ads (p,>001), self-efficacy (p<.001), TV mediation behaviors (p<.001), and ability to read food labels (p<.001) Hindin, JADA, 2004
Family-Based Interventions • Goals • Build parental/family support • Create supportive home environment • Epstein’s review of randomised controlled family-based interventions: “most pediatric obesity interventions are marked by small changes in relative weight or adiposity and substantial relapse”. • Example: program with dietary counseling, encouragement to exercise, and family tx for 14-18 months resulted in smaller increase in BMI than no tx controls (1.1 vs 2.8 kg/m2 @ 1 yr fu); drop out substantial Epstein, Pediatrics, 1998; Isreal, J Ped Psy, 1994
Family-Based Interventions • Quality (research based) • Quanity based on internal hunger/fullness • Continue to research family-based interventions • AND • Implement in the context of the socioecological model • Saturate communities with multidisciplinary teams • Ex: Heart Links Project
SocioEcological Framework for Interventions Government regs & recommendations Public Policy Factors School foods & fundraising Community Factors Institutional Factors Advertising regulations Family-based interventions Interpersonal Factors School environment Individual Community campaigns PA opportunities
Pounds per Person A 30% Increase Year www.cspinet.org
Sugar Content of Popular Foods FOODTSP “% Daily Value” Snickers bar, 2.1 oz. 5¾ 58 TastyKake Honey Bun, 3¼ oz. 6 60 Lowfat fruit-flavored yogurt, 8 oz. 7 70 Pepsi, 12 oz. 10¼ 103 Pancake syrup, ¼ cup 10¼ 103 Hostess Lemon Fruit Pie, 4½ oz. 11½ 115 Strawberry Passion Awareness Fruitopia, 20 oz. 17¾ 178 Sources: Manufacturers, USDA, CSPI analyses and/or estimates. Center for Science in the Public Interest, August, 1999
Obesity and Mortality If this trend continues, obesity will become the leading cause of death by 2005, killing 500,000 people per year. CDC 3/04
Yoplait Go-Gurt Cherry & Strawberry Assorted Yogurt Nutrition FactsServ. Size 1 tube (64g;about 2 oz) Servings 8Amount Per ServingCalories 70Calories From Fat 15% Daily Value *Total Fat 2g3%Saturated Fat 1g5%Cholesterol 5mg2%Sodium 40mg2%Potassium 125mg3%Total Carbohydrate 11g4%Dietary Fiber 0g0%Sugars 10gProtein 2g
Yoplait Go-Gurt Cherry & Strawberry Assorted Yogurt Nutrition FactsServ. Size 1 container (227g; 6 oz) Servings 1Amount Per ServingCalories 160Calories From Fat 0% Daily Value *Total Fat 0g0%Saturated Fat 0g0%Cholesterol 0mg0%Sodium 130mg5%Potassium 125mg3%Total Carbohydrate 30g10%Dietary Fiber 1g3%Sugars 29gProtein 8g