Download
1 / 20
210 likes | 335 Views
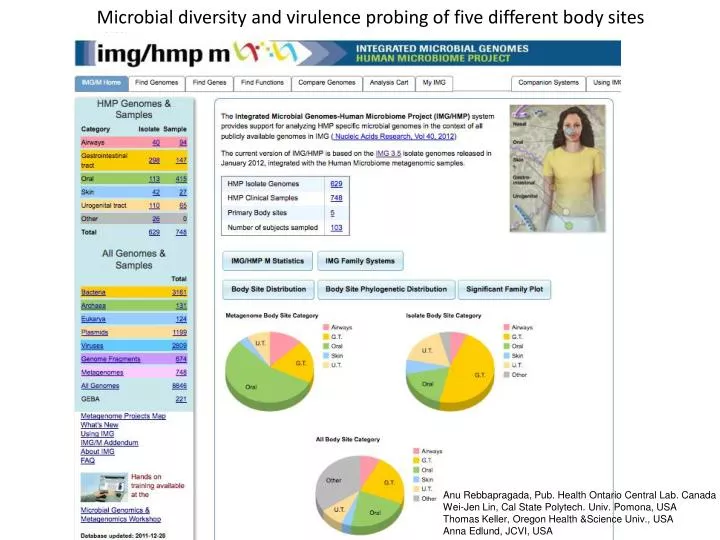
Microbial diversity and virulence probing of five different body sites. Anu Rebbapragada, Pub. Health Ontario Central Lab. Canada Wei-Jen Lin, Cal State Polytech. Univ. Pomona, USA Thomas Keller, Oregon Health &Science Univ., USA Anna Edlund, JCVI, USA. Questions:

E N D
Microbial diversity and virulence probing of five different body sites Anu Rebbapragada, Pub. Health Ontario Central Lab. Canada Wei-Jen Lin, Cal State Polytech. Univ. Pomona, USA Thomas Keller, Oregon Health &Science Univ., USA Anna Edlund, JCVI, USA
Questions: • What are the differences in taxonomic & functional diversity between and within body sites? • Is there a difference in the diversity of virulence genes between body sites?
Sample selection in IMG/HMP • Downloaded 10 metagenomes • Selected 2 metagenomes per body site Same person analyzed for skin and stool sample • Table for General Statistics • Compare Genomes • Genome Statistics • Breakdown by selected genomes, general statistics • Bar Graph for % GC • Created in Excel
Radial Tree by Class • Radial Tree • Compare Genomes • Phylogenetic Distribution • Radial Tree of 5 selected metagenomes • Customize by Phyla, Class, Domain etc categories
Bacterial diversity at class level 2 14 11 4 Nose 5 Skin Pie charts and tables created by clicking node on Radial Tree
Diversity of Archaea by Phyla and Class levels Pie charts and tables created by clicking node on Radial Tree. Radial tree customized to display at either Phyla or Class level.
Bacterial diversity behind your ear Left ear Right ear Selected only 2 metagenomes (ear samples) to generate radial tree. Pie charts and tables created by clicking node on Radial Tree. Radial tree customized to display at either Phyla or Class level.
Functional diversity across the metagenomes Compare Genomes Genome Clustering, Correlation Matrix Select metagenomes of interest Clustering method: Correlation Matrix Function: COG Display: r2 values by pairwise comparison across all metagenomes COG functions
Stool Tongue Skin Nose Vagina PCA 2-D COG groups • Compare Genomes • Genome Clustering, Correlation Matrix • Select metagenomes of interest • Clustering method: PCA Principle component analysis • Function: COG (clustering by COG pathways) • Display: 2D plot, mouse over redX to identify the metagenome identity • Created figure in powerpoint to show clustering of COGs across metagenomes • Can also show Hierarchical clustering by Function (COG, Pfam etc) or Taxonomy (Genus, Family etc) or Function Categories (COG, KEGG, Pfam)
PCA COG pathways Compare Genomes Genome Clustering, Correlation Matrix Select metagenomes of interest Clustering method: PCA Principle component analysis Function Category: COG pathway Display: 2D plot, mouse over redX to identify the metagenome identity Created figure in powerpoint to show clustering of COGs across metagenomes Nose Tongue Skin Vagina Stool Now the Nose samples don’t cluster together suggesting differences in pathways
Compare Genomes Genome Clustering, Correlation Matrix Select metagenomes of interest Clustering method: Hierarchical Function: COG Display: Phylogram showing distribution of metagenomes Hierarchical Clustering across Metagenomes by COG
Compare genomes • function comparison tool • abundance profile • function comparison • select query genome • Export table Compare COG function between Metagenomes
Secretion Pathways Select Metagenomes of interest Find Functions Search All pathways, Select KEGG pathways only Type “secretion” as Keyword Click on Pathway OID for bacterial secretion View Map
Gene Products in Type III Secretion pathway Select Metagenomes of interest Find Functions, Function Search Keyword: “Secretion”, Gene Product name, Click GO Text Filter: “Type III”, click Apply Select MetaGenomes View Profile Output: Table of Function ID (gene product name) and abundance (gene counts) in each metagenome
Gene Products in Type Vb secretion (hemolysin) pathway Select Metagenomes of interest Find Functions, Function Search Keyword: “Secretion”, Gene Product name, Click GO Text Filter: “ShlB”, click Apply Select MetaGenomes View Profile Output: Table of Function ID (gene product name) and abundance (gene counts) in each metagenome
Gene Counts Across Metagenomes for Type VI Secretion Pathway
Distribution of antibiotic resistance genes by human body sites Nose Ears Stool Tongue Vagina Select Metagenomes of interest Find Functions, Function Search Keyword: individual searches for each antibiotic resistance category under Gene Product name, Click GO Output: Table of Function ID (gene product name) and abundance (gene counts) in each metagenome Exported Table, Tally of totals in spreadsheet and created PieCharts in Excel
Antibiotic resistance in human body sitesNormalized to counts/10,000 genes
US Antibiotic Usage Data Google search :) www.cddep.org/ResistanceMap