Download
1 / 18
180 likes | 320 Views
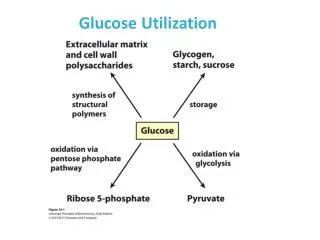
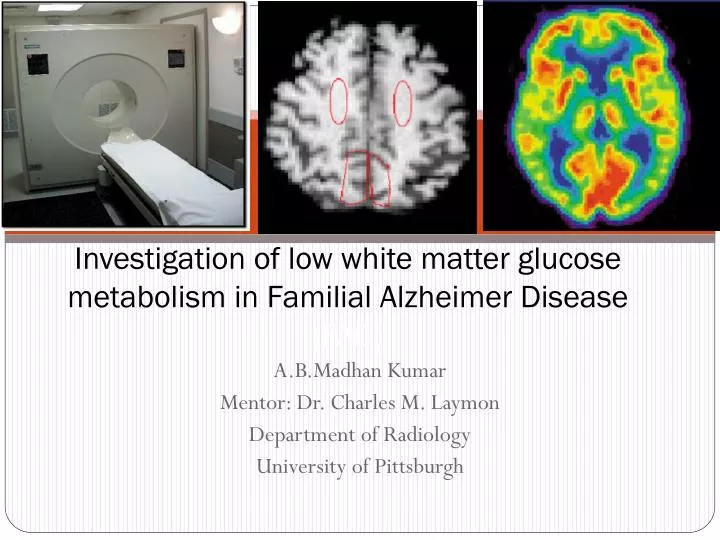
Investigation of low white matter glucose metabolism in Familial Alzheimer Disease (FAD). A.B.Madhan Kumar Mentor: Dr. Charles M. Laymon Department of Radiology University of Pittsburgh. Project Aims. To learn the principle and application of various radioligand tracers in

E N D
Investigation of low white matter glucose metabolism in Familial Alzheimer Disease (FAD) A.B.Madhan Kumar Mentor: Dr. Charles M. Laymon Department of Radiology University of Pittsburgh
Project Aims • To learn the principle and application of various radioligand tracers in • AD, FAD and control subjects • To get familiarized with different compartment models for the radiotracers • in the AD, FAD and control subjects • Data analysis of the results from the compartmental model as applied to • FAD and control subjects (FDG as tracer)
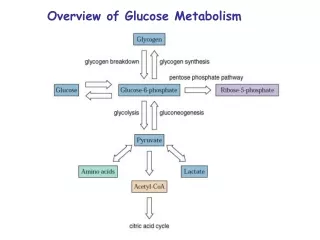
18F-FDG for PET imaging 18F-FDG-P hexokinase 18F-FDG (trapped) metabolically active cells within a tissue • In AD and certain dementias the 18F-FDG uptake by the cells are greatly diminished • due to lower glucose metabolism Red-high FDG uptake blue-low FDG uptake
MRI/PET images for FAD subject h3537 (skull removed) FDG-PET image MRI image
18F-FDG and 11C-PIB PET imaging Methodology 18F-FDG half life 110 minutes 11C-PIB half life 20 minutes For investigation in AD, the subjects are administered with: • PIB alone or (B) PIB and FDG Sequence of administration: 1. 11C-PIB first 2. 18F-FDG after about 10 half lives of PIB (approx 3-4 h later)
Motivation for this study • based on the recent observation that 18F-FDG is accumulated less in subcortical white matter region (SWM) in FAD subjects when compared to control subjects
Regional Distribution of FDG uptake in AD, FAD and control subjects (Concentration ratio to cerebellum at 60 minutes)(static PET data) cohen’sd value Control (89) AD patients (33) effect size -FAD patients (15) Subjects
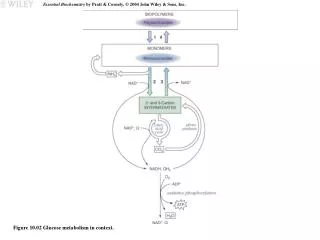
Compartments are structureless pools containing the tracers in distinct state phosphorylation perfusion Plasma Brain tissue 1818 k1 k3 18F-FDG 18F-FDG-2-P 18F-FDG k2 k4 unfixed k4 C2 C1 Cp k4 fixed(k4=0) dephosphorylation blood activity tissue activity uCi/mL uCi/mL Dynamic FDG imaging Time (min) Radioactivity decay corrected Time (min)
compartment modeling INPUT • Blood activity data (.tot files and .cor files) • Tissue data (.mic files) • ROI list OUTPUT K1, k2, k3, k4 Compartment modeling was performed after fixing and unfixing the k4 values Number of subjects FAD subjects 5 Control 2
FAD subject SWM region K4 fixed K1= 0.02972 K2=0.05622 K3=0.02728 K4=0 K1/k2= 0.5287 DV= 0
k1 FAD subjects k3 FDG (plasma) FDG (tissue) FDG-P (tissue) k2 k3 values k1/k2 in FAD subjects (k4 fixed) Degree of phosphorylation of FDG degree of perfusion/tissue extraction Regions
k1/k2 and k3 in control subjects k3 values k1/k2 values degree of phosphorylation degree of perfusion/ tissue tracer extraction
Control Vs FAD subjects K3 values in the SWM region in subjects and control (k4 fixed) 15.5% Phosphorylation of FDG contributes to the observed decreased in the FDG uptake in FAD subjects compaed to control subjects (SWM region)
K1/k2 in the FAD subjects are higher than in the controls The perfusion or tissue tracer extraction does not contribute for the observed decrease in the FDG uptake in FAD subjects (SWM region)
Fraction of phosphorylation = k3/(k2+k3) (fraction of FDG undergoing phosphorylation) k1 k3 FDG (plasma) FDG (tissue) FDG-P (tissue) k2 k4 K4 fixed 8.5%
Application to my research-experimental therapeutics Tissue targeted encapsulated agents eg. Tumor targeted nanoparticles carrying drugs perfusion Drug resistance v v vvv v vvv v vvv vvv vvv v v v vvv v v v v v v v vvv v v v vvv v v v vvv v v v v vvv v vvv vvv vvv v vvv vvv nanoparticles (plasma) v vvv tumor tissue nanoparticles internalized in tumor cells
Conclusions • 2 tissue compartment model was applied to the 18F-FDG administered FAD and normal subjects. • Our analysis represented a lower k3 values in the SWM region in FAD and in control subjects compared to other cortex regions. • The values of k3(degree of phosphorylation) in the FAD subjects in the SWM region is lower than in control by 15% • The fraction of FDG undergoing phosphorylation in FAD subjects we analyzed was 8.5 % lower than in control subjects.
Thanks • Dr. Seong-Gi Kim • Dr. William Edy • Dr.CharlesLaymon (mentor) Department of Radiology • Carl • Rhaven • Dr. William Klunk Department of Psychiatry