Download
1 / 1
10 likes | 143 Views
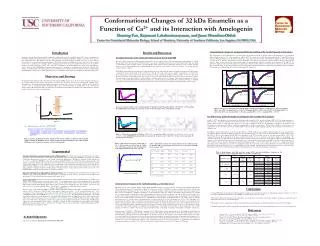
Conformational Changes of 32 kDa Enamelin as a Function of Ca 2+ and its Interaction with Amelogenin Daming Fan, Rajamani Lakshminarayanan, and Janet Moradian-Oldak Center for Craniofacial Molecular Biology, School of Dentistry, University of Southern California, Los Angeles, CA 90033, USA.

E N D
Conformational Changes of 32 kDa Enamelin as a Function of Ca2+ and its Interaction with Amelogenin Daming Fan, Rajamani Lakshminarayanan, and Janet Moradian-OldakCenter for Craniofacial Molecular Biology, School of Dentistry, University of Southern California, Los Angeles, CA 90033, USA Conformational Changes of Amelogenin Following Addition of the 32 kDa Enamelin (CD Analysis) The CD spectrum of rP172 amelogenin has a strong negative absorbance around 201 to 203 nm, which is the characteristic of polyproline II structure. In the absence of Ca2+, when enamelin was added to rP172 at a molar ratio of 1:100, the minimum in both pH 5.8 and pH 8.0 solutions decreased. With increasing ratios (1:50 and 1:10), the intensity of the minima decreased further while both peaks shifted from 201 to 203 nm at pH 5.8 and from 203 to 205 nm at pH 8.0 (Fig. 5A and 5B). Meanwhile, an isodichroic point appeared at 194 nm in pH 5.8 and at 195 nm in pH 8.0 solutions, which strongly supports the conformational changes of amelogenin upon addition of enamelin. In the presence of 2.0 mM Ca2+, the intensity of minima also decreased with addition of enamelin. An isodichroic point at 220 nm is observed at pH 5.8 while it is at 195 nm at pH 8.0 (Fig. 5C and 5D). These conformational changes suggest that the 32 kDa enamelin interacts directly with amelogenin and the domains of enamelin-Ca2+ interactions are different from those involved in enamelin-rP172 interactions. Introduction Enamelin, a phosphorylated glycoprotein that constituents a small percentage of the extracellular matrix (<5%), plays an important role in enamel formation. In developing porcine enamel, enamelins have been isolated with molecular weights of 25, 32, 45, 89, 142 and 155 kDa Among them, the 32 kDa enamelin is the most stable fragment of 186 kDa enamelin (extending from Leu174 to Arg279) and has been studied for its structural and functional properties1. The 32 kDa enamelin is hydrophilic and acidic with a pI 3.2, and is rich in proline (18.8%), glycine (12.3%), threonine (10.4%), and glutamic acid (9.4%)2. It has two phosphorylated serines (Ser191 and Ser216) and three glycosylated asparagines (Asn245, Asn252 and Asn264)2. Furthermore, the 32 kDa enamelin was shown to have high affinity to bind to apatite crystals3, highlighting relevant functional properties of enamelins in controlling crystal nucleation or growth. The addition of 32 kDa enamelin onto amelogenins also promoted the nucleation of apatite crystals4. Despite the advances in understanding enamelin primary structure, the secondary structural properties of enamelin and its interactions with ligands are still largely unexplored. Objectives and Strategy We applied circular dichroism (CD) and Fourier transform infrared (FTIR) spectroscopy to study secondary structural preferences of the 32 kDa enamelin in the absence and presence of calcium ions. We further used CD and dynamic light scattering (DLS) measurements to investigate amelogenin-enamelin interactions, in various ratios of these two proteins at pH 5.8 and 8.0 and in the presence of Ca2+. A recombinant porcine amelogenin (rP172) was used. The knowledge of calcium effect on the conformational changes of the 32 kDa enamelin and the cooperation between enamelin and amelogenin will contribute to the understanding of enamelin structure and function in enamel biomineralization. Results and Discussion Secondary Structure of the 32 kDa Enamelin analyzed by CD and FTIR The far-UV CD spectrum of the 32 kDa enamelin in Tris buffer shows two negative troughs at 207 nm with a mean residue ellipticity of -3.0x10³ deg cm2 dmol-1 and at 220 nm with -2.3x10³ deg cm2 dmol-1, and a positive maximum around 192 nm of 3.3x10³ deg cm2 dmol-1 (Fig. 2A), which are characteristics of the secondary structure of proteins having a high content of α-helix. Quantitative estimation for the secondary structural fractions of the 32 kDa enamelin by the program CDSSTR showed that it has 81.5% α-helix content, 10.1% β-sheet, 1.5% β-turns and 8.0% unordered structure (Table 1). The FTIR absorption difference spectrum of the 32 kDa enamelin shows two main bands: the amide I and amide II maxima at 1655 and 1536 cm-1 respectively, and two minor bands at 1741 and 1582 cm-1 (Fig. 2B). The amide bands contain a number of absorptions as revealed by the deconvolution and second-derivative spectra presented in Fig. 2C and 2D, respectively. It further showed a shoulder at 1671 cm-1 and a weak absorption at 1614 cm-1 in the amide I region and a peak at 1513 cm-1 in the amide II band from the deconvolution and second derivative analysis. The major amide I component (1655 cm-1) can be assigned to α-helical and/or random coil structures. Other amide I components at 1614 cm-1 region are associated with β-sheet while the shoulder at 1671 cm-1 is assigned to an anti-parallel β-sheet. The component at 1741 cm-1 is attributed to stretching vibration from the COO- groups while the band at 1582 cm-1 could be related to asymmetric stretching vibration of COO- groups. Figure 2. Secondary structure of the 32 kDa enamelin (0.17 mg/ml in 20 mM Tris buffer, pH 7.4, 0.15 M NaCl). (A) CD spectrum. (B) ATR-FTIR absorption difference spectrum. (C) Deconvolved spectrum. (D) Second-derivative spectrum. Figure 5. CD spectra of rP172 interaction with the 32 kDa enamelin (in 20 mM Tris, 0.15 M NaCl). (A) rP172 (0.19 mg/ml), pH 5.8; (B) rP172 (0.16 mg/ml), pH 8.0; (C) rP172 (0.18 mg/ml), pH 5.8, 2.0 mM CaCl2; (D) rP172 (0.11 mg/ml), pH 8.0, 2.0 mM CaCl2. (rP172 (■); enamelin:rP172 = 1:100 (▲); enamelin:rP172 = 1:50 (*); enamelin:rP172 = 1:10 (●)). The Effect of the 32 kDa Enamelin on Amelogenin Self-assembly (DLS Analysis) At pH 5.8, rP172 amelogenin has a monodisperse size distribution with a mean RH of 2.9 nm and an estimated MW of 41 kDa, suggesting dimers of rP172 molecules. The particle distribution in the rP172-enamelin solution remained monodisperse and the size was not affected when enamelin was added to rP172 at ratios of 1:100 and 1:50 to rP172. At a ratio 1:10 of enamelin to rP172, the size distribution of particles in the mixture is still monodisperse but with an increase of RH to 3.8 nm. The estimated MW for the RH 3.8 nm particles is 77 kDa, which is likely due to the formation of a complex between two rP172 molecules (based on MW 20 kDa for rP172) and one 32 kDa enamelin, indicating a direct interaction between these two enamel proteins. The influence of the 32 kDa enamelin on the self-assembly behavior of rP172 at pH 8.0 was remarkable. Without enamelin, the self-assembled rP172 nanospheres exhibited a bimodal size distribution with one major population having a mean RH of 17.6 nm and another minor population of RH of 62.9 nm (Table 2). However, the estimated RH and MW of the nanospheres in the rP172-enamelin solution become smaller upon addition of the 32 kDa enamelin. The average RH of nanospheres in the major population decreased to 15.1, 11.8, and 4.3 nm, respectively, which are corresponding to the enamelin to rP172 ratios at 1:100, 1:50 and 1:10. The nanospheres detected by DLS at the elevated ratio (1:10) might be either the enamelin-amelogenin complexes or the smaller rP172 nanospheres. We interpret these data to suggest that the particles with a mean MW of 104 kDa are likely formed by four rP172 molecules and one enamelin, generating an enamelin-amelogenin complex, or by five rP172 molecules, giving rise to a highly disassembled amelogenin particle. Although it is not possible to unambiguously define the composition of these particles, the DLS data clearly demonstrate partial dissociation of amelogenin nanospheres in a dose-dependent manner with enamelin, indicating a direct interaction between these two enamel proteins. The interaction between the 32 kDa enamelin and rP172 is likely through the tyrosyl motif at the N-terminal of amelogenin7. (B) Edman Sequence Results:LPHVPH-IPP Primary Structure of the 32 kDa Enamelin: 174LWHVPHRIPP GYGRPPTSNE EGGNPYFGFF GYHGFGGRPP YYSEEMFEQD FEKPKEKDPP KTETPATEPS VNTTVPETNS TQPNAPNPRG NDTSPTGTSG QGPNPR279 Figure 3. CD spectra of enamelin as a function of Ca2+. (Ca2+ concentrations (mM): 0 (■); 0.05, (▲); 0.2 (); 0.5, (●); 1.0, (+); 2.0, (-); 10.0, (x)). (B) ATR-FTIR absorption difference spectrum in the presence of 2.0 mM Ca2+. (C) Deconvolved spectrum. (D) Second-derivative spectrum. Figure 1. Isolation, purification and characterization of the 32 kDa enamelin. (A) Elution profile of purified 32 kDa enamelin from RP-HPLC on a C4 analytical column and stains-all staining for the 32 kDa enamelin. (B) Edman results and amino acid sequence of the 32 kDa enamelin. Figure 4. The calcium association constant (Ka) of the 32 kDa enamelin calculated from the fitting curve of the [θ]mrw at 222 nm. The determined Ka of the 32 kDa enamelin is 1.55 (±0.13) x 103 M-1. Table 1. Quantitative analysis of secondary structure of the 32 kDa enamelin (20 mM Tris, pH 7.4, 0.15 M NaCl) as a function of Ca2+. Program: CDSSTR; Ref. Protein Set: SP43 Experimental Extraction, Purification, and Characterization of the 32 kDa Enamelin: The 32 kDa enamelin was extracted following the method described previously1 and purified by reverse-phase high performance liquid chromatography (RP-HPLC), first using a C4 column (250x10 mm, Phenomenex) followed by a C18 column (250x10 mm, Phenomenex). The purity of extracted 32 kDa enamelin was above 95%, as confirmed by RP-HPLC and by stains-all staining in SDS-PAGE (Fig. 1A). A blue band with a molecular weight around 32 kDa was observed and this stains-all positive response is typical to the phosphorylated glycoprotein. For protein sequence analysis following SDS-PAGE, the gel was equilibrated in 3-[cyclohexylamino]-1-propanesulfonic acid buffer and was electrotransferred to PVDF membrane (Millipore) at 50 volts for 30 minutes. Amino acid sequence analysis was performed at the Division of Biological Sciences Protein Sequencing Facility at UCSD and the N-terminal sequence of the stains-all positive band was reported to be: LPHVPH-IPP, matching the primary structure of the 32 kDa enamelin. Expression and Purification of Recombinant Amelogenin (rP172): The recombinant porcine amelogenin rP172 was expressed in Escherichia coli, purified using RP-HPLC, and characterized as previously described5. rP172 is analogous to the full-length porcine amelogenin P173, but lacking the first methionine and a phosphate on Ser16. Spectroscopic Studies: CD measurements for the 32 kDa enamelin and its interactions with Ca2+ and amelogenin were conducted on a JASCO J-810 spectropoloarimeter calibrated using a 0.06% (+)-10-camphorsulfonic acid solution. Instrument optics and sample chamber were continually flushed with 20 liters/min of dry N2 gas. The purified and lyophilized 32 kDa enamelin was dissolved in 20 mM tris(hydroxymethyl)aminomethane (Tris) buffer at pH 7.4 with an ionic strength (IS) 0.15 (0.15 M NaCl). CD spectra were expressed as the mean residue ellipticity, [θ]mrw, (deg cm2 dmol-1), and [θ]mrw was calculated using the equation, [θ]MRW = [θ]λ × MRW/10 × l × c where [θ]λ is the observed ellipticity, MRW is the mean residual weight which is defined as the M/N-1 where M is the molecular mass (MrP172 = 19572.5; Menamelin = 32000 Da) and N is the number of amino acid residues, ‘l’ is the optical path length, and ‘c’ is the concentration of the protein (mg/mL). The secondary structure contents of the 32 kDa enamelin from the CD spectra were estimated by a FORTRAN program called CDSSTR (http://lamar.colostate.edu/~sreeram/CDPro/). The calcium binding affinity (Ka) of the 32 kDa enamelin was determined from the fitting curve of the mean residue ellipticity at 222 nm. FTIR spectra of the 32 kDa enamelin in Tris buffer (pH 7.4, IS 0.15) and in the presence of 2.0 mM Ca2+ were recorded by using a JASCO FT 4100 spectrometer equipped with a fast recovery TGS detector. The interaction between the 32 kDa enamelin and rP172 in 20 mM Tris (2.0 mM CaCl2, 0.15 M NaCl) at various ratios was investigated by DLS at pH 5.8 and pH 8.0, respectively. DLS measurements were performed by the DynaPro-99EMS/ X instrument equipped with a solid-state laser operating at 655 nm with a temperature controlled MicroSampler at 20°C (Wyatt Technologies, Santa Barbara, USA). Table 2. Hydrodynamic radii (RH), molecular weight (MW), and mass distribution of particles in the enamelin-rP172 solutions (20mM Tris buffer, 0.15 M NaCl, 2.0 mM CaCl2) a δ, root mean square deviation. Conformational Changes of the 32 kDa Enamelin as a Function of Ca2+ The CD spectra show that sequential addition of CaCl2 (0.05-10.0 mM) resulted in a progressive decrease in intensity of the minima at 208 nm and 220 nm and the maximum at 192 nm (Fig. 3A). When Ca2+ increased from 0.05 to 2.0 mM, the troughs are slightly blue-shifted to 208 nm with decreased intensity -1.4x10³ deg cm2 dmol-1 and to 221 nm of -1.0x10³ deg cm2 dmol-1. This blue shift is also observed for the positive band from 192 nm to 193 nm at 2.0 mM Ca2+. At higher concentrations (5.0 and 10 mM Ca2+), there is no further conformational change. Therefore, the 2.0 mM Ca2+ is a saturation point of calcium effect to the 32 kDa enamelin conformation. A careful examination of the CD spectra reveals the presence of an isodichroic point at 200 nm, indicating a two state equilibrium between a-helix and β-sheet conformations and a strong support to the conformational changes of the 32 kDa enamelin as a function of Ca2+. CDSSTR analyses indicate that at an initial 0.05 mM Ca2+, the α-helix content of enamelin decreased from 81.5% to 68.0% with a concomitant increase of β-sheet from 10.1% to 13.8% and β-turns from 1.5% to 7.4%. With higher Ca2+ concentrations, the α-helix content of enamelin decreased progressively while the β-sheet, the β-turns, and other structures increased simultaneously (Table 1). Such quantitative analysis clearly demonstrates that Ca2+ binding to the 32 kDa enamelin decreased its α-helix content but increased its β-sheet, β-turns, and other structures, suggesting a preference of β-sheet conformation of the enamelin in the presence of Ca2+. The calcium association constant (Ka) of the 32 kDa enamelin was calculated from the fitting curve of the [θ]mrw at 222 nm (Fig. 4). The determined Ka of the 32 kDa enamelin is 1.55 (±0.13) x 103 M-1, which is in good agreement with the value of 5.2x10³ M-1,6 indicating a weak affinity of enamelin to calcium ions. In the presence of 2.0 mM Ca2+, FTIR difference spectrum of the 32 kDa enamelin solution apparently shows the broadening of amide I band, the weakening of the amide II region and the shift of absorption of the COO- groups (Fig. 3B). The deconvolution and second-derivative spectra of enamelin with Ca2+ (Fig. 3C and 3D) show that in addition to the shoulders at 1672 cm-1 and 1614 cm-1, a new absorption appears at 1638 cm-1, which is associated with β-sheet. The presence of the new absorption and the broadening of the amide I band are in good agreement with the increase of β-sheet conformation upon the addition of Ca2+ in the CD study. The intensity of the amide II band weakened and it became broad at 1539-1543 cm-1 at 2.0 mM Ca2+. It is also noticeable that the intensity of the asymmetrical vibration of COO- group at 1582 cm-1 is significantly reduced while the symmetrical stretching mode shifts to 1749-1765 cm-1 and becomes broadened, clearly as a result of Ca2+ binding to COO- groups. • Conclusions • CD and FTIR studies showed that the 32 kDa enamelin has a high content of α-helix and undergoes conformational transition to β-sheet as a result of Ca2+ addition. The 32 kDa enamlelin has a weak binding to Ca2+ through the carboxylate groups. • DLS analyses demonstrated that the 32 kDa enamelin has a profound effect on amelogenin self-assembly at pH 8.0, giving rise to partial dissociation of rP172 nanospheres in a dose dependent manner. • We interpret our data to suggest that the 32 kDa enamelin interacts with amelogenin, most likely through the Tyr-rich motif at the N-terminal. • We further suggest that the 32 kDa enamelin and amelogenin may cooperate to control crystal growth during the post-secretory stage of amelogenesis. • References • Yamakoshi, Y. Calcif. Tissue Int.1995; 56, 323-330., Brookes et al 2002, Connect Tissue Res, 43: 477-481. • Hu, C. C., and Y. Yamakoshi. Crit. Rev. Oral. Biol. Med. 2003; 14, 387-398. • Tanabe, T., T. Aoba, E. C. Moreno, M. Fukae, and M. Shimizu. Calcif. Tissue Int.1990; 46, 205-215. • Bouropoulos, N., and J. Moradian-Oldak. J. Dent. Res.2004; 83, 278-282. • Ryu, O. H., A. G. Fincham, C. C. Hu, C. Zhang, Q. Qian, J. D. Bartlett, and J. P. Simmer. J. Dent. Res.1999; 78, 743-750. • Yamakoshi, Y., T. Tanabe, S. Oida, C. C. Hu, J. P. Simmer, and M. Fukae. Arch. Oral Biol.2001; 46, 1005-1014. • Ravindranath, R. H., J. Moradian-Oldak, and A. G. Fincham. J. Biol. Chem.1999; 274, 2464-2471. Acknowledgements This work was funded by NIDR/NIH grants DE-13414 and DE-15644.