Download
1 / 31
310 likes | 421 Views
Study of the Effectiveness of Additional Reductions in Cholesterol and Homocysteine. Rory Collins and Jane Armitage on behalf of the SEARCH Collaborative Group.

E N D
Study of the Effectiveness of AdditionalReductions in Cholesterol and Homocysteine • Rory Collins and Jane Armitage on behalf of the SEARCH Collaborative Group • Financial Disclosure: SEARCH was designed, conducted and analysed by Oxford University independently of the grant source (Merck & Co). No honoraria or consultancy fees accepted.
SEARCH: 2 separate randomized treatment comparisons in 12,064 post-MI patients • More versus less LDL-lowering comparison: • Simvastatin vs Simvastatin • 80 mg daily 20mg daily • Homocysteine-lowering comparison: • Folic acid 2mg plus vs Placebo • vitamin B12 1mg daily tablets • Mean (SD) duration: 6.7 (1.5) years
SEARCH: Eligibility criteria • Previous myocardial infarction • Men and women • Aged 18 to 80 years • Current use of, or clear indication for, statin • No admission in previous 3 months for MI, unstable angina or coronary revascularisation (and none planned in next 3 months)
SEARCH: Vascular outcome definitions • MAJOR CORONARY EVENTS = Non-fatal MI, coronary revascularisation or CHD death • STROKE = Any non-fatal or fatal stroke (including subarachnoid haemorrhage) • REVASCULARISATION = Coronary or non-coronary • artery surgery or angioplasty (including amputation) • MAJOR VASCULAR EVENTS = MCE • + stroke • + revascularisation
SEARCH: 2 separate randomized treatment comparisons in 12,064 post-MI patients • More versus less LDL-lowering comparison: • Simvastatin vs Simvastatin • 80 mg daily 20mg daily • Homocysteine-lowering comparison: • Folic acid 2mg plus vs Placebo • vitamin B12 1mg daily tablets • Mean (SD) duration: 6.7 (1.5) years
SEARCH: Baseline LIPID levels after 2 monthpre-randomisation run-in on SIMVASTATIN 20mg daily *Non-fasting
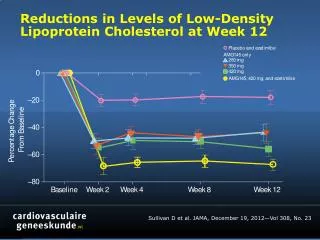
SEARCH: Reduction in LDL CHOLESTEROL with allocation to 80mg versus 20 mg SIMVASTATIN daily
SEARCH: Myopathy ratesby SIMVASTATIN comparison Myopathy: New, unexplained muscle pain or weakness plus CK>10x ULN (7 vs 0 developed rhabdomyolysis)
SEARCH: Effects of more vs less STATIN on MORTALITY Simvastatin allocation Risk ratio & 95% CI Cause of death 80mg 20mg 80mg better 20mg better (n=6031) (n=6033) CHD 447 (7.4%) 438 (7.3%) Stroke 57 (0.9%) 67 (1.1%) Other vascular 53 (0.9%) 56 (0.9%) All vascular 557 (9.2%) 561 (9.3%) 0.7% SE 5.9 reduction Neoplastic 245 (4.1%) 266 (4.4%) Respiratory 74 (1.2%) 58 (1.0%) Other medical 75 (1.2%) 70 (1.2%) Non-medical 13 (0.2%) 14 (0.2%) All non-vascular 407 (6.7%) 408 (6.8%) 0.2% SE 7.0 reduction All causes 964 (16.0%) 969 (16.1%) 0.5% SE 4.6 reduction 0.6 0.8 1.0 1.2 1.4
SEARCH: Effects of more vs less STATIN on ANY CANCER by year of follow-up Simvastatin allocation Risk ratio & 95% CI Year of follow-up 80mg 20mg 80mg better 20mg better 1 73 /6031 (1.2%) 73 /6033 (1.2%) 2 98 /5907 (1.7%) 95 /5896 (1.6%) 3 96 /5734 (1.7%) 88 /5733 (1.5%) 4 89 /5538 (1.6%) 93 /5569 (1.7%) 5 106 /5373 (2.0%) 96 /5379 (1.8%) 6 82 /5160 (1.6%) 99 /5190 (1.9%) 7+ 95 /4954 (1.9%) 133 /4970 (2.7%) 2+ 566 /5907 (9.6%) 604 /5896 (10.2%) 6.1% SE 5.7 reduction ALL FOLLOW-UP 639 /6031 (10.6%) 677 /6033 (11.2%) 5.4% SE 5.4 reduction 0.6 0.8 1.0 1.2 1.4
TNT PROVE-IT IDEAL More vs less (5 trials) A to Z SEARCH CTT meta-analysis: Proportional reduction in MAJOR VASCULAR EVENTS versus absolute LDL-C reduction 30% 25% Statin vs control (18 trials) 20% 15% Proportional reduction in vascular event rate (95% CI) 10% 5% 0% 0.0 0.5 1.0 Mean LDL cholesterol difference between treatment groups (mmol/L)
Events (%) Treatment Control RR (CI) per 1 mmol/L Study (n=71998) (n=71991) reduction in LDL-C Statin vs. Control trials Subtotal (18 trials) 7063 (13.5%) 8843 (16.9%) 0.79 (0.77 - 0.81) More vs. Less trials 274 (13.1%) 333 (16.1%) 0.71 (0.51 - 0.98) PROVE-IT A to Z 281 (12.4%) 316 (14.2%) 0.66 (0.34 - 1.25) 936 (18.7%) 1215 (24.3%) 0.63 (0.52 - 0.75) TNT IDEAL 938 (21.1%) 1106 (24.9%) 0.71 (0.58 - 0.88) 1477 (24.5%) 1553 (25.7%) 0.86 (0.68 - 1.09) SEARCH Subtotal (5 trials) 3906 (19.7%) 4523 (22.9%) 0.70 (0.65 - 0.77) Overall (23 trials) 10969 (15.2%) 13366 (18.6%) 0.78 (0.76 - 0.80) 99% or 95% CI 0.5 0.75 1 1.25 1.5 Treatment better Control better 2 Heterogeneity within more vs less trials: c 7.34 (p=0.12) = 4 2 c 6.73 (p=0.01) Difference between more vs less and statin vs control trials: = 1 CTT meta-analysis: Effects of STATIN on MAJOR VASCULAR EVENT per mmol/l LDL-C reduction
CTT meta-analysis: Effects of STATIN on STROKE per mmol/l LDL-C reduction Events (%) Treatment Control RR (CI) per 1 mmol/L Study (n=71998) (n=71991) reduction in LDL-C Statin vs. Control trials Subtotal (18 trials) 1526 (3.0%) 1807 (3.5%) 0.84 (0.79 - 0.89) More vs. Less trials 21 (1.0%) 19 (0.9%) 1.15 (0.32 - 4.08) PROVE-IT A to Z 28 (1.2%) 36 (1.6%) 0.43 (0.06 - 3.12) 117 (2.3%) 155 (3.1%) 0.63 (0.38 - 1.05) TNT IDEAL 151 (3.4%) 174 (3.9%) 0.77 (0.46 - 1.30) 255 (4.2%) 279 (4.6%) 0.79 (0.45 - 1.41) SEARCH Subtotal (5 trials) 572 (2.9%) 663 (3.4%) 0.73 (0.59 - 0.92) Overall (23 trials) 2098 (2.9%) 2470 (3.5%) 0.83 (0.78 - 0.88) 99% or 95% CI 0.5 0.75 1 1.25 1.5 Treatment better Control better 2 Heterogeneity within more vs less trials: c 2.06 (p=0.73) = 4 2 c 1.25 (p=0.26) Difference between more vs less and statin vs control trials: = 1
CTT meta-analysis: Effects of STATIN on NON-FATAL MI or CHD DEATH per mmol/l LDL-C reduction Events (%) Treatment Control RR (CI) per 1 mmol/L Study (n=71998) (n=71991) reduction in LDL-C Statin vs. Control trials Subtotal (18 trials) 3629 (7.0%) 4826 (9.2%) 0.76 (0.74 - 0.79) More vs. Less trials 147 (7.0%) 172 (8.3%) 0.77 (0.49 - 1.20) PROVE-IT A to Z 187 (8.3%) 222 (9.9%) 0.56 (0.26 - 1.22) 324 (6.5%) 411 (8.2%) 0.67 (0.50 - 0.92) TNT IDEAL 404 (9.1%) 459 (10.3%) 0.79 (0.57 - 1.09) 742 (12.3%) 808 (13.4%) 0.79 (0.57 - 1.11) SEARCH Subtotal (5 trials) 1804 (9.1%) 2072 (10.5%) 0.74 (0.65 - 0.84) Overall (23 trials) 5433 (7.5%) 6898 (9.6%) 0.76 (0.74 - 0.79) 99% or 95% CI 0.5 0.75 1 1.25 1.5 Treatment better Control better 2 Heterogeneity within more vs less trials: c 2.07 (p=0.72) = 4 2 c 0.23 (p=0.63) Difference between more vs less and statin vs control trials: = 1
TNT A to Z PROVE-IT IDEAL More vs less (5 trials) SEARCH CTT meta-analysis: Proportional reduction in NON-FATAL MI or CHD DEATHversus absolute LDL-C reduction 30% Statin vs control 25% (18 trials) 20% Proportional reduction in coronary event rate (95% CI) 15% 10% 5% 0% 0.0 0.5 1.0 Mean LDL cholesterol difference between treatment groups (mmol/L)
CTT meta-analysis: Effects of MORE vs LESS STATIN (0.5 mmol/l lower LDL-C) on MAJOR VASCULAR EVENTS Events (%) RR (CI) Outcome Treatment Control 1175 (5.9%) 1380 (7.0%) 0.85 (0.76 - 0.94) Non fatal MI 730 (3.7%) 804 (4.1%) 0.91 (0.80 - 1.03) CHD death Any major coronary event 1804 (9.1%) 2072 (10.5%) 0.86 (0.81 - 0.92) 637 (3.2%) 731 (3.7%) 0.86 (0.75 - 0.99) CABG PTCA 1167 (5.9%) 1508 (7.6%) 0.76 (0.69 - 0.84) Unspecified 322 (1.6%) 382 (1.9%) 0.82 (0.68 - 1.00) Any coronary revascularisation 2126 (10.7%) 2621 (13.2%) 0.80 (0.75 - 0.85) Haemorrhagic stroke 63 (0.3%) 57 (0.3%) 1.10 (0.69 - 1.77) 509 (2.6%) 606 (3.1%) 0.84 (0.72 - 0.98) Presumed ischaemic stroke Any stroke 572 (2.9%) 663 (3.4%) 0.86 (0.77 - 0.96) Any major vascular event 3777 (19.0%) 4376 (22.1%) 0.85 (0.81 - 0.89) 99% or 95% CI 0.5 0.75 1 1.25 1.5 Treatment better Control better
21% relative risk reduction per mmol/L Statin 16% relative risk reduction per 0.5 mmol/L More statin Or: ~40% relative risk reduction per 2 mmol/L Absolute effects on MAJOR VASCULAR EVENTS of lowering LDL cholesterol with STATIN therapy Control 20 15 Five year risk of a major vascular event, % 10 Combined evidence: 33% relative risk reduction per 1.5 mmol/L (since 0.79 x 0.84 = 0.67) 5 0 0 1 2 3 4 5 LDL cholesterol, mmol/L
SEARCH: 2 separate randomized treatment comparisons in 12,064 post-MI patients • More versus less LDL-lowering comparison: • Simvastatin vs Simvastatin • 80 mg daily 20mg daily • Homocysteine-lowering comparison: • Folic acid 2mg plus vs Placebo • vitamin B12 1mg daily tablets • Mean (SD) duration: 6.7 (1.5) years
SEARCH: Reduction in HOMOCYSTEINE with allocation to FOLATE/B12 versus placebo Mean (SD) baseline: 13.5 (5) µmol/l
BVTT meta-analysis: Effects of FOLATE on MAJOR VASCULAR EVENTS by trial Events (%) Treatment Control (n=11,658) (n=11,707) Risk ratio (CI) (n=17,691) (n=17,691) Trial 1.21 (0.84- 1.73) CHAOS-2 111 (11.8) 95 (10.1) 1.06 (0.86- 1.30) WENBIT 327 (21.2) 313 (20.2) 1.01 (0.82- 1.25) VISP 300 (16.4) 300 (16.2) 0.96 (0.86- 1.08) NORVIT 978 (52.2) 1011 (53.9) 1.02 (0.84- 1.23) WAFACS 376 (13.8) 366 (13.5) 1.01 (0.89- 1.15) HOPE-2 790 (28.7) 796 (28.8) 1.04 (0.95- 1.14) SEARCH 1537 (25.5) 1493 (24.8) 1.02 (0.98- 1.06) Total 4419 (25.0) 4374 (24.7) 0.5 1.0 2.0 99% CI 99% CI Treatment Control 95% CI 95% CI better better
SEARCH: FOLATE/B12 on MAJOR VASCULAR EVENTS Folate allocation Risk ratio & 95% CI Event Active Placebo Active better Placebo better (n=6033) (n=6031) Non-fatal MI 431 (7.1%) 429 (7.1%) Coronary revascularisation 590 (9.8%) 591 (9.8%) CHD death 463 (7.7%) 422 (7.0%) Major coronary events 1229 (20.4%) 1185 (19.6%) 4.7% SE 4.2 increase Fatal stroke 59 (1.0%) 65 (1.1%) Non-fatal stroke 218 (3.6%) 222 (3.7%) Total stroke 269 (4.5%) 265 (4.4%) 1.8% SE 8.7 increase Non-coronary revascularisation 178 (3.0%) 153 (2.5%) 16.9% SE 11.9 increase MAJOR VASCULAR EVENTS 1537 (25.5%) 1493 (24.8%) 4.0% SE 3.7 increase 0.6 0.8 1.0 1.2 1.4
SEARCH: FOLATE/B12 on MAJOR VASCULAR EVENTS by year of follow-up Folate allocation Risk ratio & 95% CI Year of follow-up Active Placebo Active better Placebo better 1 265 /6033 (4.4%) 228 /6031 (3.8%) 2 220 /5751 (3.8%) 236 /5783 (4.1%) 3 232 /5483 (4.2%) 197 /5511 (3.6%) 4 192 /5202 (3.7%) 194 /5257 (3.7%) 5 221 /4958 (4.5%) 192 /5010 (3.8%) 6 192 /4680 (4.1%) 209 /4749 (4.4%) 7+ 215 /4400 (4.9%) 237 /4467 (5.3%) 2+ 1272 /5751 (22.1%) 1265 /5783 (21.9%) 1.8% SE 4.0 increase ALL FOLLOW-UP 1537 /6033 (25.5%) 1493 /6031 (24.8%) 4.0% SE 3.7 increase 0.6 0.8 1.0 1.2 1.4
SEARCH: FOLATE/B12 on MAJOR VASCULAR EVENTS by baseline HOMOCYSTEINE Folate allocation Risk ratio & 95% CI Active Placebo Active better Placebo better Homocysteine (µmol/L) <11 363 /1735 (20.9%) 377 /1736 (21.7%) ≥11 <14 563 /2255 (25.0%) 521 /2315 (22.5%) ≥14 611 /2043 (29.9%) 595 /1980 (30.1%) ALL PATIENTS 1537 /6033 (25.5%) 1493 /6031 (24.8%) 4.0% SE 3.7 increase 0.6 0.8 1.0 1.2 1.4
SEARCH: Effects of FOLATE/B12 on MORTALITY Folate allocation Risk ratio & 95% CI Cause of death Active Placebo Active better Placebo better (n=6033) (n=6031) CHD 463 (7.7%) 422 (7.0%) Stroke 59 (1.0%) 65 (1.1%) Other vascular 51 (0.8%) 58 (1.0%) All vascular 573 (9.5%) 545 (9.0%) 5.5% SE 6.1 increase Neoplastic 260 (4.3%) 251 (4.2%) Respiratory 67 (1.1%) 65 (1.1%) Other medical 67 (1.1%) 78 (1.3%) Non-medical 16 (0.3%) 11 (0.2%) All non-vascular 410 (6.8%) 405 (6.7%) 1.6% SE 7.0 increase All causes 983 (16.3%) 950 (15.8%) 3.8% SE 4.6 increase 0.6 0.8 1.0 1.2 1.4
BVTT meta-analysis: Effects of FOLATE on CANCER SUBTYPES Events (%) Treatment Control HR (CI) (n=16,751) (n=16,796) Cancer Subtypes 1.10 (0.83- 1.46) Colorectal 175 (1.0) 160 (1.0) Other gastrointestinal 1.05 (0.76- 1.46) 129 (0.8) 123 (0.7) 1.14 (0.91- 1.44) Prostate 265 (1.6) 233 (1.4) Other genitourinary 1.02 (0.78- 1.35) 178 (1.1) 173 (1.0) Lung 1.11 (0.85- 1.44) 206 (1.2) 186 (1.1) 0.83 (0.60- 1.16) Breast 111 (0.7) 132 (0.8) 0.96 (0.56- 1.65) Melanoma 44 (0.3) 46 (0.3) Haematological 0.98 (0.67- 1.43) 93 95 (0.6) (0.6) 1.07 (0.87- 1.31) Other 320 (1.9) 302 (1.8) 1.05 (0.98- 1.13) ALL 1521 (9.1) 1450 (8.6) 0.5 1.0 2.0 99% CI 99% CI Treatment Control 95% CI 95% CI better better
BVTT meta-analysis: Effects of FOLATE on CANCER by year of follow-up Events (%) Treatment Control (n=16,751) (n=16,796) HR (CI) Year of follow-up Year 1 0.93 (0.75- 1.15) 286 (1.7) 309 (1.8) Year 2 1.16 (0.94- 1.43) 323 (2.0) 279 (1.7) Year 3 1.12 (0.88- 1.42) 244 (1.7) 219 (1.5) Year 4 1.11 (0.86- 1.43) 212 (1.7) 193 (1.5) Year 5 1.02 (0.79- 1.33) 196 193 (1.9) (1.8) Years 6+ 1.02 (0.81- 1.28) 260 (3.0) 257 (3.0) 1.05 (0.98- 1.13) Total 1521 (9.1) 1450 (8.6) 2 c = Test for trend : 0.04 ; p=0.9 1 0.5 1.0 2.0 99% CI 99% CI Treatment Control 95% CI 95% CI better better
Summary of SEARCH findings in context of meta-analyses of previous trials • More versus less LDL-lowering comparison: • SEARCH results are consistent with previous trials of statin vs control and of more vs less statin • Larger reductions in LDL cholesterol with statin therapy produces larger reductions in major vascular events • No excess of non-vascular outcomes (e.g. cancer) when LDL cholesterol is reduced to very low levels • Homocysteine-lowering comparison: • Lowering homocysteine with folic acid supplementation is safe, but does not reduce the risk of vascular events
SEARCH: Absolute risk of MYOPATHY by rs4149056 genotype in SLCO1B1 gene C allele frequency: 15% OR per C allele: 4.5 60% of myopathy cases by Year 5 attributable to C allele % who have had myopathy Years since starting 80mg simvastatin
SEARCH: More vs less STATIN on MAJOR VASCULAR EVENTS Simvastatin allocation Risk ratio & 95% CI Event 80mg 20mg 80mg better 20mg better (n=6031) (n=6033) Non-fatal MI 397 (6.6%) 463 (7.7%) Coronary revascularisation 571 (9.5%) 610 (10.1%) CHD death 447 (7.4%) 438 (7.3%) Major coronary events 1189 (19.7%) 1225 (20.3%) 3.6% SE 4.0 reduction Fatal stroke 57 (0.9%) 67 (1.1%) Non-fatal stroke 210 (3.5%) 230 (3.8%) Total stroke 255 (4.2%) 279 (4.6%) 8.6% SE 8.3 reduction Non-coronary revascularisation 144 (2.4%) 187 (3.1%) 23.1% SE 9.7 reduction MAJOR VASCULAR EVENTS 1477 (24.5%) 1553 (25.7%) 5.8% SE 3.5 reduction 0.6 0.8 1.0 1.2 1.4