Download
1 / 31
320 likes | 576 Views
Scenarios of the Canadian Climate Severity Index. Trevor Murdock, M.Sc. Canadian Institute for Climate Studies 5 Nov 2003 Ouranos derived data and climatic indices meeting, Montr é al. Scenarios of the Canadian Climate Severity Index. Trevor Murdock, M.Sc.

E N D
Scenarios of the Canadian Climate Severity Index Trevor Murdock, M.Sc. Canadian Institute for Climate Studies 5 Nov 2003 Ouranos derived data and climatic indices meeting, Montréal
Scenarios of the Canadian Climate Severity Index Trevor Murdock, M.Sc. Canadian Institute for Climate Studies 5 Nov 2003 Ouranos derived data and climatic indices meeting, Montréal Based on project Funded by CCAF. Collaborators: Rick Lee1,Francis Zweirs2, Elaine Barrow3, Ron Hopkinson4, David W. Phillips4, Badal Pal1 and Fred Herfst1. 1Canadian Institute for Climate Studies (CICS), 2Canadian Center for Climate Modelling and Analysis (CCCma), 3Canadian Climate Impacts and Scenarios Project (CCIS), 4Environment Canada
Outline • CICS and CCIS • Goals • What is the CSI? • Steps & Results • Original • Revised • Model • Overview • Recommendations and Summary * Scatterplots
1. Canadian Institute for Climate Studies www.cics.uvic.ca • Launched in 1993 to “further the understanding of the climate system, its variability and potential for change and to further the application of that understanding to decision making in both the public and private sectors.” • Climate Research Network, Climate Applications Projects (consulting), Seasonal Climate Predictions, Climate Network Newsletter, Canadian Climate Impacts and Scenarios Project (CCIS)
1. Canadian Climate Impacts and Scenarios (CCIS) www.cics.uvic.ca/scenarios • Delivery (since 1999) of consistent scenarios over Canada, background info, tools, user assistance, training, workshops • Staff: • Dr. Elaine Barrow Co-Principal Investigator (AIRG, Regina) • Dr. Philippe Gachon Co-principal Investigator (AIRG-Ouranos, Montreal) • Trevor Murdock Senior Research Associate & Webmaster (CICS, Victoria) • AIRG provides project direction and support staff; CICS provides support staff
2. Goals • Compute projections of a climate change index that Canadians can relate to • Environment Canada’s Climate Severity Index • To make it available online www.cics.uvic.ca/severity
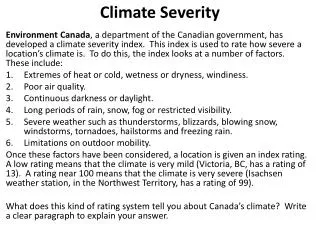
3. What is the CSI? • Index 0 to 100 developed by Phillips and Crowe (EC) • Measures spatial variation of severity of climate • Weighted factors and sub-factors chosen based on combination of survey results and climate expertise (different weightings of factors considered) • Constrained by the data available (daily data records and hourly data summaries) at time of development • Note: CSI is not the same as recent analysis which has received media attention by David Phillips based on various measures of severity at 100 cities across Canada (not an aggregate index) http://www.on.ec.gc.ca/weather/winners/
What is The CSI? Winter Discomfort 35% 10% Length of Winter • Number of months with temperature less than 0ºC 10% Severity of Winter • Temperature of coldest month 15% Wind Chill • Percent of time in January that (hourly) wind chill exceeds 1400 W/m2
What is The CSI? Summer Discomfort 15% • Humidex, Length of Summer, Warmth of Summer, Dampness Psychological 20% • Darkness, Sunshine, Wet Days, Fog Hazard 20% • Strong Winds, Thunderstorms, Blowing Snow, Snowfall Outdoor Mobility 10% • Snowfall, Visibility, Freezing Precipitation
a. Original CSI Recreated to validate methodology and analyze changes over observed record b. Revised CSI Adjustments to accommodate differences between station and GCM c. Model CSI Generate CSI scenarios from GCM output 4. Steps
4a. Original CSI Map of Canada Phillips, D.W. and R.B. Crowe (1984):Climate Severity Index for Canadians, Atmospheric Environment Service, Environment Canada CLI-1-84. 43 pp.
4a. Original CSI Map of Canada Phillips, D.W. and R.B. Crowe (1984):Climate Severity Index for Canadians, Atmospheric Environment Service, Environment Canada CLI-1-84. 43 pp.
4a. Observed Change in CSI • The original CSI based mainly on daily climate data (1941-1970) and hourly data summaries (1957-1966) for 146 stations • CSI project had 1953-1995 data for 15 stations • Recent climate generally warmed and gotten wetter. What had that done to the CSI? • CSI recalculated for 15 stations using daily and hourly data for: • 1953-1970 (closest overlap with original) • 1953-1980 (next 30 yr normal period) • 1961-1995 (most recent period)
4b. Revised CSI • Hourly / daily parameterizations (26% of index) CSI recalculated using only daily data (because scenarios of future climate do not provide hourly output) • Humidex: synthetic hourly temperature and specific humidity obtained by adjusting the daily average data by the difference between the mean observation for each hour (by month) and the daily mean • Strong winds: synthetic reconstruction not applicable – no consistent diurnal cycle; instead fit linear trend between daily mean wind and # of hours above threshold • Wind chill: neither approach worked well – instead used the exact ratio of number of hours to number of days with wind chill above threshold
4a-b. Results - CSI recalculated Average results 15 stations across Canada
4c. Scenarios of CSI • Canadian CGCM1 IS92A GHG+A1 (ga1) model grid (coupled general circulation model version 1 using greenhouse gas and sulphate aerosol forcing) • Time slices: 2010-2039 (2020s), 2040-2069 (2050s), and 2070-2099 (2080s) • Steps to compute Model CSI: • Derivations of CSI factors from available model output • Interpolation from stations to grid of hourly/daily parameterizations • Removal of model bias
Interpolation • Hourly/daily parameterizations required at each location that model CSI would be computed at • Ideally, model data would be interpolated to the 15 available stations • Project specifications required gridded model CSI • Parameterizations interpolated from sparse stations to model grid • Sensitivity to low number of stations tested … found account for likely no more than 7% of value of CSI
Removal of model bias • Model typically cloudier, less windy, wetter, warmer, and more humid than observations over 1961-1995 • Ideally change fields of each parameter would be computed at stations and applied to the CSI but not straightforward for daily output and requires computation at stations only then interpolation to grid • Instead, CSI computed for future from direct GCM output then change between model CSI future and baseline applied to observed baseline for CSI scenarios
Note on interpretation • CSI reflects personal comfort only - other aspects of climate with indirect effects beyond scope of project: • no penalty for dry winter causing water supply problems following summer (dryness no matter how severe improves CSI) • no attempt to address health risk, economic impacts, etc. • no new sub-factors included such as UV index • Modelled decrease in CSI cannot be interpreted as overall improvement in climate • indicates only an increase in how often individuals might consider the weather "a nice day" • In this narrow perspective only, the modelled CSI implies an improvement over the next century.
6. Summary • First step • Slight decrease over observed record • Reconstructed CSI close to original at most stations • Scenarios - pattern of national decrease over the next century • www.cics.uvic.ca/severity • Interpret with caution!! • Recommend development of new technique that: • makesuse of currently available station data and/or GCM outputs • can be computed from multiple GCM runs • varies temporally instead of (or as well as) spatially • can be extended to sectoral/economic indices • can be computed on different spatial scales • Partially completed proposal to extend
Canadian Climate Impacts and Scenarios Project (CCIS) www.cics.uvic.ca/scenarios