Download
1 / 28
280 likes | 394 Views
TAU Performance DataBase Framework (PerfDBF). Allen D. Malony malony@cs.uoregon.edu Department of Computer and Information Science Computational Science Institute University of Oregon. Outline. Motivation for performance databases TAU performance system TAU Performanc DataBase Framework

E N D
TAU Performance DataBaseFramework (PerfDBF) Allen D. Malony malony@cs.uoregon.edu Department of Computer and Information Science Computational Science Institute University of Oregon
Outline • Motivation for performance databases • TAU performance system • TAU Performanc DataBase Framework • Architecture • XML profile data representation • Example • Performance engineering in software engineering • X-PARE (eXPeriment Alerting and Reporting) • Concluding remarks
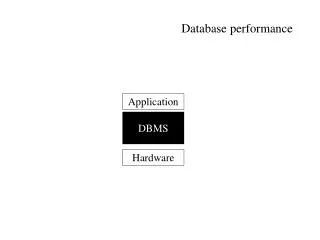
Why Performance Databases? • Focus on empirical performance optimization process • Necessary for multi-results performance analysis • Multiple experiments (codes, versions, platforms, …) • Historical performance comparison • Integral component of performance analysis framework • Improved performance analysis architecture design • More flexible and open tool interfaces • Supports extensibility and foreign tool interaction • Performance analysis collaboration • Performance tool sharing • Performance data sharing and knowledge base
Experiment Schemas PerformanceTuning hypotheses Performance Diagnosis properties Experiment Trials Performance Experimentation characterization Performance Observation observability requirements ? Empirical-Based Performance Optimization Process
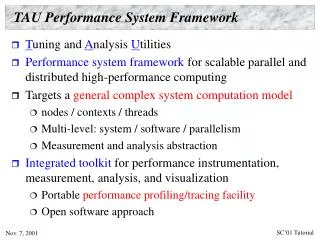
TAU Performance System Framework • Tuning and Analysis Utilities (aka Tools Are Us) • Performance system framework for scalable parallel and distributed high-performance computing • Targets a general complex system computation model • nodes / contexts / threads • Multi-level: system / software / parallelism • Measurement and analysis abstraction • Integrated toolkit for performance instrumentation, measurement, analysis, and visualization • Portable performance profiling/tracing facility • Open software approach
TAU Performance System Architecture Paraver EPILOG
Performanceanalysis programs Raw performance data Performance data description Performance analysis and query toolkit PerfDML translators ORDB PostgreSQL . . . PerfDB TAU Performance Database Framework • profile data only • XML representation • project / experiment / trial
PerfDBF Components • Performance Data Meta Language (PerfDML) • Common performance data representation • Performance meta-data description • PerfDML translators to common data representation • Performance DataBase (PerfDB) • Standard database technology (SQL) • Free, robust database software (PostgresSQL) • Commonly available APIs • Performance DataBase Toolkit (PerfDBT) • Commonly used modules for query and analysis • Facility analysis tool development
Common and Extensible Profile Data Format • Goals • Capture data from profile tools in common representation • Implement representation in a standard format • Allow for extension of format for new profile data objects • Base on XML (obvious choice) • Leverage XML tools and APIs • XML parsers, Sun’s Java SDK, … • XML verification systems (DTD and schemas) • Target for profile data translation tools • eXtensibile Stylesheet Language Transformations (XSLT) • Which performance profile data are of interest? • Focus on TAU and consider other profiling tools
Performance Profiling • Performance data about program entities and behaviors • Code regions: functions, loops, basic blocks • Actions or states • Statistics data • Execution time, number of calls, number of FLOPS ... • Characterization data • Parallel profiles • Captured per process and/or per thread • Program-level summaries • Profiling tools • prof/gprof, ssrun, uprofile/dpci, cprof/vprof, …
PerfDBF Example • NAS Parallel Benchmark LU • % configure -mpiinc=/usr/include -mpilib=/usr/lib64 -arch=sgi64-fortran=sgi -SGITIMERS -useropt=-O2 NPB profiled With TAU Standard TAU Output Data TAU XML Format TAU to XML Converter Database Loader SQL Database AnalysisTool
Scalability Analysis Process • Scalability study on LU • % suite.def # of procs -> 1, 2, 4, and 8 • % mpirun -np 1 lu.W1 • % mpirun -np 2 lu.W2 • % mpirun -np 4 lu.W4 • % mpirun -np 8 lu.W8 • populateDatabase.sh • run Java translator to translate profiles into XML • run Java XML reader to write XML profiles to database • Read times for routines and program from experiments • Calculate scalability metrics
Raw TAU Profile Data • Raw data output • One processor: "applu ” 1 15 2939.096923828125 248744666.5830078 0 GROUP="applu“ • Four processors: "applu ” 1 15 2227.343994140625 51691412.17797852 0 GROUP="applu“ "applu ” 1 15 2227.343994140625 51691412.17797852 0 GROUP="applu“ "applu " 1 14 596.568115234375 51691519.34106445 0 GROUP="applu“ "applu " 1 14 616.833251953125 51691377.21313477 0 GROUP="applu" group name profile calls exclusive time inclusive time name subs calls
XML Profile Representation • One processor <instrumentedobj> <funcname> 'applu '</funcname> <funcID>8</funcID> <inclperc>100.0</inclperc> <inclutime>2.487446665830078E8</inclutime> <exclperc>0.0</exclperc> <exclutime>2939.096923828125 </exclutime> <call>1</call> <subrs>15</subrs> <inclutimePcall>2.487446665830078E8</inclutimePcall> </instrumentedobj>
XML Representation • Four processor mean <meanfunction> <funcname>'applu '</funcname> <funcID>12</funcID> <inclperc>100.0</inclperc> <inclutime>5.169148940026855E7</inclutime> <exclperc>0.0</exclperc> <exclutime>1044.487548828125</exclutime> <call>1</call> <subrs>14.25</subrs> <inclutimePcall>5.1691489E7</inclutimePcall> </meanfunction>
Scalability Analysis Results • Scalability of LU performance experiments • Four trial runs Funname | processors | meanspeedup …. applu | 2 | 2.0896117809566 applu | 4 | 4.812100975788783 applu | 8 | 8.168409581149514 … exact | 2 | 1.95853126762839071803 exact | 4 | 4.03622321124616535446 exact | 8 | 7.193812137750623668346
Current Status and Future • PerfDBF prototype • TAU profile to XML translator • XML to PerfDB populator • PostgresSQL database • Java-based PostgresSQL query module • Use as a layer to support performance analysis tools • Make accessing the Performance Database quicker • Continue development • XML parallel profile representation • Basic specification • Opportunity for APART to define a common format
Performance Tracking and Reporting • Integrated performance measurement allows performance analysis throughout development lifetime • Applied performance engineering in software design and development (software engineering) process • Create “performance portfolio” from regular performance experimentation (couple with software testing) • Use performance knowledge in making key software design decision, prior to major development stages • Use performance benchmarking and regression testing to identify irregularities • Support automatic reporting of “performance bugs” • Enable cross-platform (cross-generation) evaluation
XPARE - eXPeriment Alerting and REporting • Experiment launcher automates measurement / analysis • Configuration and compilation of performance tools • Instrumentation control for Uintah experiment type • Execution of multiple performance experiments • Performance data collection, analysis, and storage • Integrated in Uintah software testing harness • Reporting system conducts performance regression tests • Apply performance difference thresholds (alert ruleset) • Alerts users via email if thresholds have been exceeded • Web alerting setup and full performance data reporting • Historical performance data analysis
Mail server Web server XPARE System Architecture Experiment Launch Performance Database Performance Reporter Alerting Setup Comparison Tool Regression Analyzer
Other Performance Database Projects • HPM Toolkit (DeRose; IBM) • PPerfDB (Karavanic; Portland State University) • HPCView (Mellor-Crummey, Fowler;Rice) • SCALEA (Fahringer, Truong; University of Vienna) • EXPERT (Mohr, Wolf; Research Center Juelich)
Acknowledgements • University of Oregon • Li Li, Robert Bell, Sameer Shende • University of Utah • Alan Morris, Steve Parker, Dav St. Germain • Department of Energy (DOE), ASCI AcademicStrategic Alliances Program (ASAP) • Computational Science Institute, ASCI/ASAPLevel 3 projects with LLNL / LANL,University of Oregonhttp://www.csi.uoregon.edu • Center for the Simulation of Accidental Fires andExplosions (C-SAFE), ASCI/ASAP Level 1 center, University of Utahhttp://www.csafe.utah.edu