Statistical Reasoning
230 likes | 537 Views
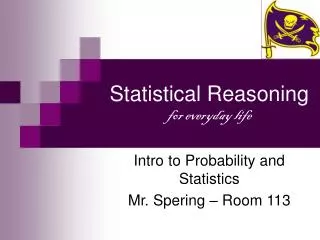
The Power of Statistics. Statistical Reasoning. Intro to Probability and Statistics Mr. Spering – Room 113. 1.1 What is/are statistics?.

Statistical Reasoning
E N D
Presentation Transcript
The Power of Statistics Statistical Reasoning Intro to Probability and Statistics Mr. Spering – Room 113
1.1 What is/are statistics? • Population- Any set of people or objects with something in common. Anything could be a population. We could have a population of college students. We might be interested in the population of the elderly. Other examples include: single parent families, people with depression, or burn victims. For anything we might be interested in studying we could define a population. Population is a complete set of people or objects being studied • Very often we would like to test something about a population. For example, we might want to test whether a new drug might be effective for a specific group. It is impossible most of the time to give everyone a new treatment to determine if it worked or not. Instead we commonly give it to a group of people from the population to see if it is effective. This subset of the population is called a sample. • When we measure something in a population it is called a parameter. Hence, a population parameter are specific characteristics of the population. When we measure something in a sample it is called a statistic. For example, if I got the average age of parents in single-family homes, the measure would be called a parameter. If I measured the age of a sample of these same individuals it would be called a statistic. Thus, a population is to a parameter as a sample is to a statistic. • Works Cited: http://faculty.uncfsu.edu/dwallace/Lesson%201.pdf (Fayetteville University N.C.)
1.1 What is/are statistics? • Raw data: actual measurements or observations collected from the sample. • Sample statistics: characteristics of the sample found by consolidating or summarizing the raw data
1.1 What is/are statistics? • Margin of Error: • Range of values likely to contain the population parameter. Usually cited to a specific confidence interval, such as, 80%, 90%, 95%, or 99%.
1.1 What is/are statistics? • MAPPING A STATISTICAL STUDY start 1. Identify goals 2. Draw from population POPULATION SAMPLE 5. Draw conclusions 3. Collect raw data and summarize 4. Make inferences about population POPULATION PARAMETERS SAMPLE STATITICS Figure 1.2 from page 7 of your textbook…
1.1 What is/are statistics? • Descriptive vs. Inferential • Descriptive → objective simply state the findings…These are numbers that are used to consolidate a large amount of information. Any average, for example, is a descriptive statistic. So, batting averages, average daily rainfall, or average daily temperature are good examples of descriptive statistics.
1.1 What is/are statistics? • Descriptive vs. Inferential • Inferential → make predictions based on findings, most useful…Inferential statistics are used when we want to draw conclusions. For example when we want to determine if some treatment is better than another, or if there are differences in how two groups perform. A good book definition is using samples to draw inferences about populations. It’s April what should I carry in my car??
1.2 Sampling • Census is a collection of data from every member of a population • Example – height of all students at your school • Often impractical • Population too large • Expensive • Time-consuming
1.2 Sampling • Census • Most statistical studies can be done without one • Collect data from a SAMPLE, to make an inference to the whole population • REPRESENTIVE SAMPLE – Relevant characteristics of the sample which generally represents the population
1.2 Sampling • Example #1: Representative Sample • A Representative Sample for Heights • Which is better…Basketball Team vs. Statistics Class? • Statistics Class • Bias • Favoring certain results • If members of sample differ in specific way • Researcher bias if he or she has a personal stake • Data set itself biased if collected intentionally or unintentionally in a way that makes data a poor representation • A graph is biased if it only tells part of the story in a misleading way.
1.2 Sampling • Example #2: Unbiased Samples Why Use Nielsen?? • Independent Source—Reduce Bias • Sampling Methods • Sampling Type 1: Simple Random Samples – Random population • Use a drawing • Using a hat • Random number generator
1.2 Sampling • Example # 3: Types of Sampling • Conduct an opinion poll with residents in town… • Telephone Book Sampling: GOOD OR NOT GOOD • NOT A GOOD SAMPLE?? • Sampling Type 2: Systematic Sampling • Every 50th member
1.2 Sampling Systematic sampling vs. simple random sampling • A systematic sample can be a relatively random sample. Example # 4: Museum Assessment
1.2 Sampling • Example # 5: When Systematic Sampling Fails • Co-ed dormitory • Odd rooms vs. even rooms (DUH!) • Picking every 10th room • Try a convenience sample • Sampling Type 3: Convenience sampling • It is convenient
1.2 Sampling • Example # 6: • Salsa Taste Test • New brand of salsa • Convenience sample??? GOOD OR NOT GOOD… • NOT GOOD! Why? • Self-selected sample • Most likely those who like salsa • Bias?? Try Cluster Samples – divide population into groups, groups selected at random, but obtain sample of all members from cluster
1.2 Sampling • Sampling Type 4: Cluster sampling • Example # 7:Gasoline Prices • Cluster Sampling leads to… • Sampling Type 5: Stratified Samples • Concerned with differences among the subgroups or STRATA, within the population • Identify strata, draw a random sample from each stratum which will provide a sample from the individual strata
1.2 Sampling • Example # 8: Unemployment Data… • 2,000 geographic areas (subgroups)…households randomly selected within areas • Stratified Sampling (Strata are randomly sampled) • Subgroups or strata – in order to correctly represent and make inferences on all subjects within a population.
1.2 Sampling • Summary of Sampling Methods • Successful when the population is represented • Biased??? Check that your sampling method DOES represent • Choose carefully and properly, but you may still have bad luck • Page 17 Figure 1.3 reviews sample methods
1.2 Sampling • Summary of Sampling Methods • Simple Random • Systematic • Convenience • Cluster • Stratified
1.1 What is/are statistics? • PURPOSE of STATISTICS….(is not lying) Statistics has infinite uses and influences, but perhaps the most important purpose is to help us make “good”, well informed predications and decisions regarding issues of uncertainty
1.1 What is/are statistics? • PURPOSE of STATISTICS…. Statistics has infinite uses and influences, but perhaps the most important purpose is to help us make “good”, well informed predications and decisions regarding issues of uncertainty
1.2 Sampling • HOMEWORK # 2: • pg 9 # 3-27 by 3’s • Pg 18 # 9-29 odd • Don’t cheat… check your work! Simple random sampling Stratified sampling Cluster sampling Systematic sampling Convenience sampling