Download
1 / 9
90 likes | 116 Views
Learn how to create a winning science fair poster by including all essential elements, organizing effectively, and designing for impact. This template helps with pre-visualization, sizing graphics, and experimenting with versions. Cover sections like Abstract, Results, Procedure, Problem, Hypothesis, Variables, and Analysis. Follow tips for a catchy title, creative visuals, and clear explanations to impress judges. Improve design, layout, and content based on feedback provided in the example.

E N D
Science fair display via presentation To make a science fair poster, students love to focus on the use of colors, flashy fonts, and glitter. Fine. But it is more important to make sure that all the elements are included, and that the organization is clear. The next slide is a template that could help a student do these things: • Make sure that all the elements are present • Pre-visualize how the parts of the project will be presented • Get a sense size you’ll need to make your graphics and text • Easily experiment with different versions of the poster
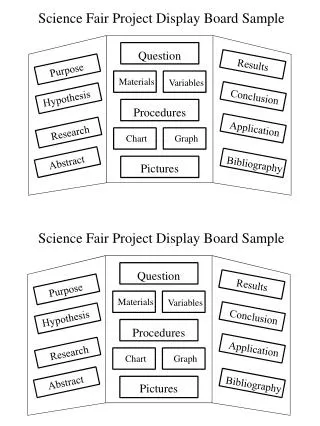
A general purpose outline How you organize this is up to you. You may need to makes sections bigger or smaller. You may need a lot of photos and graphs or tables, or not.But make sure you include all of the parts. Judges are looking for Abstract: States title, problem, and summarizes what was learned and why it matters. Results: Tell what your graphs and tables show. Say if your hypothesis was supported or not. Procedure – info that would allow another to repeat the experiment. 1 Each step with details. 2 Use measurements when you can. 3 E.g., I added 5 grams. I used 5 plants that averaged 15cm in height. 4 Etc Problem: Some background that helps explain what you’re investigating and why. What is the big question you would like to answer? Graph Titile Catchy Title Judges really like to see an interesting problem and creative use of materials and methods. Look at the judges rubric so you know how to get the best score. Axis title Axis title Hypothesis: If we do ____ we think ______ because _______. Very good if you can state a reason for the hypothesis (observation, or written source). Variables: The independent variable (the thing you changed) and the dependent variable (the thing you measured). Analysis and Conclusion: Restate main result. Explain why we might have seen these results. What errors might there have been (no experiment is perfect). How is our result useful in the real world? What would be a good follow-up experiment? Graph or photo Graph or photo Caption for photo or diagram Caption Variables: 1. List what was used. 2 Use measurements, 3 like, “a 100 cm dish.: 4 Graph or photo References: 1. 2. 3. Judges are looking for all sections to be complete. They want explanations to be clear. They want to know why you did this experiment, and why the results are useful or interesting. Caption – showing method or resuit Caption for photo or diagram
Science fair display via presentation The next slide is an example to show you could modify the template. The yellow boxes are examples of feedback that a teacher might offer.
Mr. C’s wacky example. Just to give you ideas about layout. This project would not get a good grade. • Roach Facts: • Taste like chicken • Smart as a chimp • Have six legs • But no toes • And so on Results: All of the cockroaches crawled out of the hot tubs immediately after release. I was not able to effectively evaluate my hypothesis. One problem with my experiment is that my simulated hot tubs did not have lids to keep the insects in. Also, since my hot tubs were made out of cheep plastic the water leeked on the floor and my Mom got on my case Title does not tell us anything about the problem studied. The “facts” idea is good but these have nothing to do with the experiment. Methods 1 Obtained hissing roaches from tub in Vivarium 2 Placed roaches into simulated hot tubs 3 Adjusted hot tub temperatures to low, medium, high 4 Measured how high roaches jumped This shows that the experiment was poorly designed. The methods should have been improved and the experiment repeated. Hot Tub Bugsroaches What kind of tubs? This info should be in a section about materials. Problem:My family pets have always enjoyed our hot tub. But I note that our parakeet, beagle, and tabby cat are all warm-blooded (homeothermic.) I wondered whether a cold-blooded insect would adapt well to a hot tub. What temperatures were used? How were they measured? Effect of temp on roach jumping This problem does not deal with anything that a scientist would really want to know. Height of Jump, cm The graph shows growth, not height. Hot tub temp, C No statement of variables. No abstract. Caption for photo or diagram Conclusion: My roaches did not understand myt experiment so they did not give a good result. In the future I will put lids on the tubs and make sure they do not leek. I enjoyed my experiment but my mom did not like it Hypothesis: Roaches would prefer cooler hot tub temperatures, because they are used to having cold blood. Materials: 1 2 3 4 Not logical, shows a misunderstanding of “cold blood.” Good to state the limitations of the experiment and consider ways to improve it. But there is no discussion of the problem addressed in this study. No references
An example for Grade 4 Number of plants sprouted Total number of seeds germinated Methods 1 On Jan 26, we put soil into 2 trays and compost into 2 trays. Then we planted 2 clover seeds in each cell. 2 We kept the plants in the greenhouse and watered them every 1-2 days. 3 We made our measurements on March 5, 8, and March 15th. We counted the number of plants that had germinated and the height in centimeters of each plant. Problem: We wanted to learn if red clover might grow better in compost than in potting soil. The answer to our question would help Mr. C know which kind of soil or compost he should use. Height of plants Compost and Pot soil: plant germination and height Plant height in centimeters Hypothesis:If we compare pot soil and compost then we think that compost would win because we thought that compost had more nutrients. The bench where we put the plants. Results: We found out that by March 15th, only 18 seeds had sprouted in the compost. In the soil, there were 26 seeds sprouted. The compost plants were also shorter than the soil plants, the average was 15 cm compared to 22 cm for the soil plants. Conclusion: We found out that pot soil was better to grow plants in. Our hypothesis was not supported. The pot soil might actually have more nutrients than compost. When we looked at the label on the bag, we found that fertilizer was added. Our result will help Mr. C know how to grow clover plants better. Independent variable: soil or compost. Dependent variables: germination and plant height. Materials: 1 Potting soil (Grow-mix)2 Compost from bottom layer of worm composter in Vivarium.3 Tap water 4 Red clover seeds5 4 trays each with 6 cells.)trays (each space 6 X 4 ½ X 6 cm)6 Ruler Tray with 6 cells and 2 seeds per space. The plants were kept on a tray in the greenhouse.
Science fair display via presentation The next 3 slides are of actual posters, with comments about display.
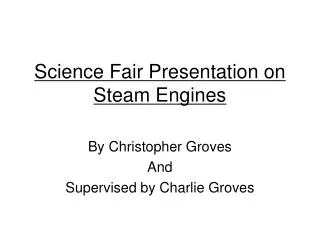
Nice: Creates a sense of outer space. Graphics at corners. Arrows tell me what’s important. Type size: can I read this from a distance? Title sizes: “Purpose” is big. “Results” should be same size, because it is equally important.
Nice: Huge title, intriguing. Nice text borders. Uncluttered, clean. Using several types of graphics (table, chart, diagram) adds interest. Only 2 font sizes for text helps keep it simple. Type size: can I read this from a distance? The bar charts are very important, but the axis titles are tiny.
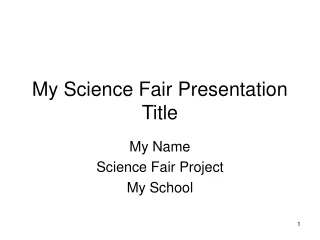
Nice: Easy to see all parts of project at a glance Not an impressive project, but simple, uncluttered. Title is most important, should probably be larger font. Several parts are missing: variables, abstract, references.