U2U Tools
U2U Tools. Wisconsin Crop Management Conference Madison, Wisconsin January 14, 2016. Chad Hart Iowa State University chart@iastate.edu. A Little Bit about U2U.

U2U Tools
E N D
Presentation Transcript
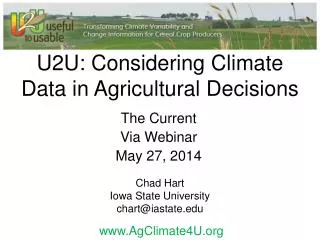
U2U Tools Wisconsin Crop Management Conference Madison, Wisconsin January 14, 2016 Chad Hart Iowa State University chart@iastate.edu
A Little Bit about U2U Our goal is to help producers make better long-term plans on what, when and where to plant, and also how to manage crops for maximum yields and minimum environmental damage.
AgClimate View • Plot local temperature and precipitation variation as far back as 1980, • Track county crop yields and trends, and • Consider crop yields in the context of temperature, precipitation, and growing degree day data • Used in tandem with other decision resources, AgClimate View can help you find long-term correlations between climate trends and yields, while helping you put your recent crop experience into historical context.
Corn Growing Degree Days • This tool puts current conditions into a 30-year historical perspective and offers trend projections through the end of the calendar year. Growing Degree Day (GDD) projections, combined with analysis of historical analog data, can help you make decisions about: • Climate Risks – Identify the likelihood of reaching maturity before frosts/freezes. • Activity Planning – Consider corn hybrid estimated physiological maturity requirements, along with GDD projections when making seed purchasing and other growing season decisions. • Marketing – Look at historical and projected GDD when considering forward pricing and crop insurance purchases.
Climate Patterns Viewer • This tool provides a historical (1981-2010) look at how the El Niño Southern Oscillation (ENSO) and Arctic Oscillation (AO) have affected local climate conditions across the Corn Belt. You can explore the influence on: • average monthly total precipitation, • average monthly temperature, • deviations of these variables from 1981-2000 normals, and • deviations of these variables from neutral phases. • The maps can help you make decisions about: • Climate Risks – Identify periods of more extreme weather. • Activity Planning – Consider crop choice and irrigation needs. • Marketing – Explore forward pricing alternatives.
Split Nitrogen Application • This tool is designed to help farmers and farm advisors understand the risks and benefits of using post-planting nitrogen (N) application for corn production. The tool combines historical weather and fieldwork data with economic considerations to determine the feasibility and profitability of completing a second (split) N application within a user-specified time period. This tool may help you with decisions that: • Increase corn yields • Reduce nitrogen costs • Reduce nitrogen losses to the environment • Affect the likelihood of completing in-season fieldwork.