Download
1 / 18
180 likes | 208 Views
This study outlines a method for accurate classification of cancer metastases in histological whole slide images using CNN, CRF, and DBSCAN clustering. Techniques include patch extraction, tissue region segmentation, test-time color augmentation, data sampling, and train-time data augmentation with Inception v3. The approach incorporates false positive bootstrapping and test-time color augmentation for improved accuracy.

E N D
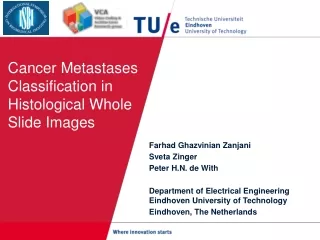
Cancer Metastases Classification in Histological Whole Slide Images Farhad Ghazvinian Zanjani Sveta Zinger Peter H.N. de With Department of Electrical Engineering Eindhoven University of Technology Eindhoven, The Netherlands
Method Outline Patch extraction Tissue region segmentation Test-time color augmentation CNN CRF Blob analysis DBSCAN clustering Class label Input slide 2 Method
Tissue Region Extraction • Ignoring the empty zero-filled regions • Computing a threshold map • Assigning an Otsu threshold to each pixel by sliding a window • Clamping the computed threshold map by 10% of Global Otsu threshold • Using Morphology for removing small isolated objects in the binary image 3 Method
Tissue Region Extraction Small isolated regions removal Threshold map Binary slide Input Color Slide 4 Method
Data Sampling • Random patch extraction from slides • Cropped from original full resolution slides • Select patches inside the tissue-region mask • 256x256 pixels • Balanced classes • Ignore some marginal patches which contain both classes and less than 75% of dominant class 5 Method
Train-time Data Augmentation • Flipped up/down/left/right • Rotated 90/180/270 degrees (fast matrix computation) • Color augmented • Transforming to HSV color coordinates • Adding random offset to H, S and V channels • Brightness (V channel) has been scaled randomly • On the fly implementation 6 Method
Convolutional Neural Networks • Inception v3 vsGoogleNet (v1) Original inception module [1] Inception v3 module [1] [1] Szegedy, Christian, et al, 2016. [2] Winner of Camelyon 2016. https://camelyon16.grand-challenge.org/ 7 Method
Convolutional Neural Networks • GoogleNet - Inception v3 • Initial parameters have been optimized on ImageNet12 dataset • Resizing input to 299x299 • Changing the output softmax layer for two-class prediction • Changing learning rate by monitoring the performance on validation set • Weight decay regularization 8 Method
False Positive Bootstrapping (hard-mining) • Retraining the network after adding false positive prediction to the training set • Effects: • Increasing accuracy about 1% on test set • Small reduction in recall 9 Method
Test-time Color Augmentation • Two approaches can be devised for tackling with the high color variations of staining in pathology WSIs • Normalizing all slides to the color space of a reference [1] • Training color space variations to the model [1] Bejnordi, B. Ehteshami, et al. 2016. 10
Test-time Color Augmentation • Using color deconvolution [1] for finding ROI of absorbing Hematoxylin and Eosin • Using stain standardization method for color conversion [2] DAB Eosin RGB Hematoxylin Deconvolution Binarized HSD color space Histogram transformation Template Converted color [1] Ruifrok, Arnout C., and Dennis A. Johnston, 2001. [2] Bejnordi, B. Ehteshami, et al. 2016. 11
Examples of Color Conversion (negative and positive patches) Eosin Hematoxylin Original converted Eosin Hematoxylin converted Original Center 1 Center 1 Center 2 Center 2 Center 3 Center 3 Center 4 Center 4 Center 5 Center 5 Negative samples Positive samples 12 Method
Color Conversion Between Samples of 5 Medical Centers Target Center 3 Center 2 Center 1 Center 4 Center 5 Center 1 Source Center 2 Center 3 Center 4 Center 5 13 Method
Test-time Color Augmentation • Convert the color of test input patch to have a similar distribution to the training examples of different medical centers • Select the less uncertain prediction of the network on the color-augmented set 14 Method
Post processing – Conditional Random Field (CRF) Zoom ROI GT CRF PNet( x=tumor) > 0.9 PNet( x=tumor) > 0.5 15 Method
Blob Analysis and DBSCAN clustering • Computing the major axes of a fitted ellipse to the tumor region • Computing the area of Hematoxylin mask, inside the tumor region • If slide has been labeled as itc or micro metastases, then check by DBSCAN clustering Input slide Detected positive regions clustered 16 Method
Result • Our method on Camelyon17 test set shows 0.87 kappa score in patient-level 17 Result
Conclusion • We used a machine learning method, based on convolutional neural networks • Inception v3 has been used as a pixel classifier • False positive bootstrapping improves the prediction performance • Test-time color augmentation used for decreasing the prediction uncertainty • Using Conditional Random Field improves the label assignment 18 Conclusion