Download
1 / 33
330 likes | 350 Views
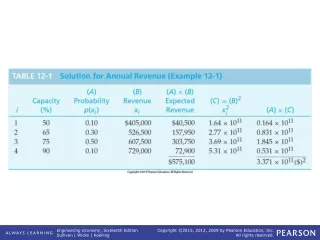
TABLE 12-1 Solution for Annual Revenue (Example 12-1). TABLE 12-2 Solution for AW (Example 12-1). TABLE 12-3 Expected Equivalent Annual Cost (Example 12-2). TABLE 12-4 Expected Equivalent Annual Cost (Example 12-3). TABLE 12-5 Calculation of E (PW) and E [(PW) 2 ] (Example 12-4).

E N D
Figure 12-3Probabilistic Cash Flows over Time (Example 12-6)
TABLE 12-12 Monte Carlo Simulation of PW Involving Four Independent Factors (Example 12-9)
Figure 12-5 Monte Carlo Simulation Using a Spreadsheet, Example 12-9
Figure 12-6 Plot of Cumulative Average PW to Determine whether Enough Simulation Trials Have Been Run
Figure 12-7 Histogram Showing Distribution of PW for 1,000 Simulation Trials
TABLE 12-13 Simulation Results for Three Mutually Exclusive Alternatives
Figure 12-8 Graphical Summary of Computer Simulation Results
TABLE 12-14 Monetary Outcomes and Decisions at Each Point — Deterministic Replacement Example of Figure 12-9a
TABLE 12-15 Decision at Each Point with Interest = 25% per Year for Deterministic Replacement Example of Figure 12-9