Download

1 / 16
160 likes | 185 Views
CRGAQS: CAMx 2018 Results. Presentation to the Gorge Study Technical Team By ENVIRON International Corporation February 21, 2007. Today’s Presentation. Describe 2018 CAMx simulation 2018 emissions review “What-if” scenario emissions review Results for August 2004 episode Next Steps.

E N D
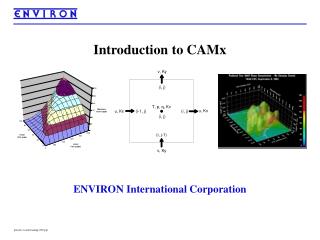
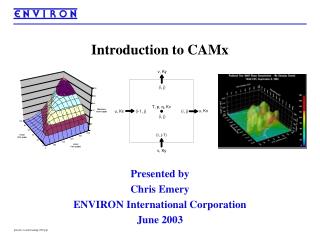
CRGAQS:CAMx 2018 Results Presentation to the Gorge Study Technical Team By ENVIRON International Corporation February 21, 2007
Today’s Presentation • Describe 2018 CAMx simulation • 2018 emissions review • “What-if” scenario emissions review • Results for August 2004 episode • Next Steps
2018 Emissions • From WRAP 2018 SMOKE IDA files • Uses 2004 emissions for: • Biogenics • Fires • Natural wind-blown dust • Natural ammonia sources • Employed same fugitive dust adjustments as 2004: • Canopy escape factors • Fine/coarse speciation splits
What-If Scenarios • Case 01 – zero Boardman emissions • Case 02 – zero NH3 emissions for PSAT region 5 (east of Gorge) • Case 03 – zero on-road mobile source emissions for PSAT region 2 (Portland and Vancouver) • Case 04 – zero major point source emissions for PSAT region 2 • Case 05 – zero major point source emissions for PSAT region 1 (in-Gorge)
What-If Scenarios • Following slides are presented with no emissions scale • This is to show that emissions changes indeed were incorporated into the modeling as expected
What-If Scenario (Case 01) Grid Cell (103, 50) Location as derived From EPA data Grid Cell (103, 52) 2018 zero Boardman (note that Morrow County has no emissions) 2018 Base Case (data from WRAP Note: Boardman position change)
What-If Scenario (Case 02) Ammonia Emissions (All Sources)
What-If Scenario (Case 03) On-Road Mobile Source CO On-Road Mobile Source NOX
What-If Scenario (Case 04) • Area highlighted in blue is PSAT region 2 (Portland-Vancouver) • Major stationary sources with CO emissions are shown • Figure on left is 2018 base case • Figure on right is the Case 04 What-If Scenario
What-If Scenario (Case 05) • Area highlighted in blue is PSAT region 1 (In-Gorge) • Major stationary sources with CO emissions are shown • Figure on left is 2018 base case • Figure on right is the Case 05 What-If Scenario
Next Steps • Continue with remaining “what-if” scenarios • Investigate “what-if” responses • Complete report • New funding • Emission issues (2018 POA?) • 2018 PSAT for Aug 2004 episode • Improve Nov 2004 performance • 2018 for Nov 2004 episode • 2004+2018 PSAT for Nov 2004 episode