Download

1 / 32
320 likes | 423 Views
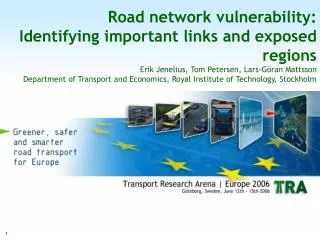
Road network vulnerability Important links and areas, exposed users. Erik Jenelius Dept. of Transport and Economics Royal Institute of Technology (KTH) Stockholm jenelius@infra.kth.se. The project. Dep. of Transport and Economics, KTH

E N D
Road network vulnerability Important links and areas, exposed users Erik JeneliusDept. of Transport and EconomicsRoyal Institute of Technology (KTH)Stockholm jenelius@infra.kth.se
The project Dep. of Transport and Economics, KTH Supervisor Prof. Lars-Göran MattssonAssist. supervisor Dr. Katja Vourenmaa Berdica Time period 2007-2010 Funded by Swedish Road Administration and Swedish Agency for Innovation Systems http://www.infra.kth.se/tla/projects/vulnerability/index_eng.html
Vulnerability analysisMotivation Events sometimes occur that severely disrupt transportation services Can have big impacts on individuals and businesses For individuals: reduced accessibility to social services, loss of access to/time for work, school, daycare, shopping, recreation, etc. For businesses: loss of manpower/customers, delayed deliveries, increased freight costs, etc.
Vulnerability analysisAim Before occurrence, identify scenarios that would have severe consequences for society could occur in the future Important sub-tasks: Identify critical points/areas where incidents are likely and/or could have particularly severe impacts Identify users/regions that would be particularly affected by an incident
Vulnerability analysisValue In planning stage: Adjust location/structure of roads to risks Support road projects providing redundancy to existing network In maintenance/operations stage: Probability of disruption can be reduced by upgrades and maintenance Consequences can be reduced by information and swift restoration
ConceptsImportance A link or larger area is important if disruption there would have severe impacts for users overall An operator’s perspective of vulnerability
ConceptsExposure A group of users is exposed to a certain scenario if it would have severe impacts for the group We study regional exposure: users grouped according to municipality/county of trip origin
Analysis focus Large-scale real-world road networks Full-range analysis (”all links”) Draw generalizable conclusions
Impact model Simple indicator: Delay with only route adjustment Users assumed to minimize travel time In Swedish applications, link travel times assumed unchanged by disruption Data requirements: Network (nodes, links) Link travel times Travel demand between zones (demand nodes)
Impact model Unsatisfied demand: Users unable to travel during disruption Calculate delay as waiting time until reopening, assuming constant travel demand (to be revised in future applications)
Case studies Geographical disparities in vulnerability Area-covering disruptions
Link importance Total delay due to link closure 48 h closure
1. Regional disparities in vulnerabilityMotivation Study geographical variations in vulnerability Can these differences be explained by network structure and travel patterns? Can we find simple proxy variables?
Regional exposure and importance Expected user exposure: Average delay per traveller starting the region due to disruption of random link in the whole network Expected importance: Total delay for travellers in the whole network due to disruption of random link in the region
user exposure (10-6 h) importance (h)
Regression analysis Regress exposure and importance on variables capturing network structure and travel patterns of the own region Both exposure and importance should be high if network density low Exposure high if average user travel time long Importance high average link flow large
Network density Three measures of increasing simplicity and data availability: Redundancy and scale: #links / #nodes and average link length Road density: Total network length / region area Population density
link length (km) road density (km-1)
aver. user travel time (h) aver. flow (veh/h)
Conclusions Long-term vulnerability strongly determined by network structure and travel patterns Complex measures can be approximated with simple variables Difficult to affect patterns with infrastructure investments
2. Area-covering disruptionsMotivation Extend single-link analysis to areas Develop methodology for systematic analysis Apply to large real-world road networks Where are area-covering disruptions most severe? What differs from single-link failures?
Methodology Study area is covered with grid of equally shaped and sized cells Each cell represents spatial extent of disruptive event Event representation: All links intersecting cell are closed, remaining links unaffected Square Hexagonal
Methodology Multiple, displaced grids used to increase accuracy No coverage bias: Each point in study area equally covered Avoids combinatioral issues with multiple link failures Easy to combine with frequency data
Case study Cell importance: Total increase in travel time for all users when cell is disrupted Three square cell sizes: 12.5 km, 25 km, 50 km
Cell importance 25 km grids Each small square shows mean importance of the four intersecting cells
Cell importance Unsatisfied demand constitutes on average 60% - 90% of total delay For most important cells, almost all delay due to unsatisfied demand Unsatisfied demand consists of internal, inbound/outbound and crossing demand
Ratio cell/mean link importance Ratio largest where both demand and network are dense
Conclusions Other factors behind vulnerability to area-covering disruptions compared to single link failures: demand concentration Vulnerability reduced through allocation of restoration resources rather than increasing redundancy For important cells, unsatisfied demand constitutes nearly all increase in travel time
Thank you! Papers: Jenelius, E., Petersen, T. & Mattsson, L.-G. (2006), ”Importance and exposure in road network vulnerability analysis”, Transportation Research Part A 40, 537-560. Jenelius, E. (2009a), ”Network structure and travel patterns: Explaining the geographical disparities of road network vulnerability”, Journal of Transport Geography 17, 234-244. Jenelius, E. (2009b), ”Considering the user inequity of road network vulnerability”, Journal of Transport and Land Use, forthcoming. Jenelius, E. (2009c), ”Road network vulnerability analysis of area-covering disruptions: A grid-based approach with case study”, submitted. http://www.infra.kth.se/tla/projects/vulnerability/index_eng.html