Download
1 / 25
250 likes | 408 Views
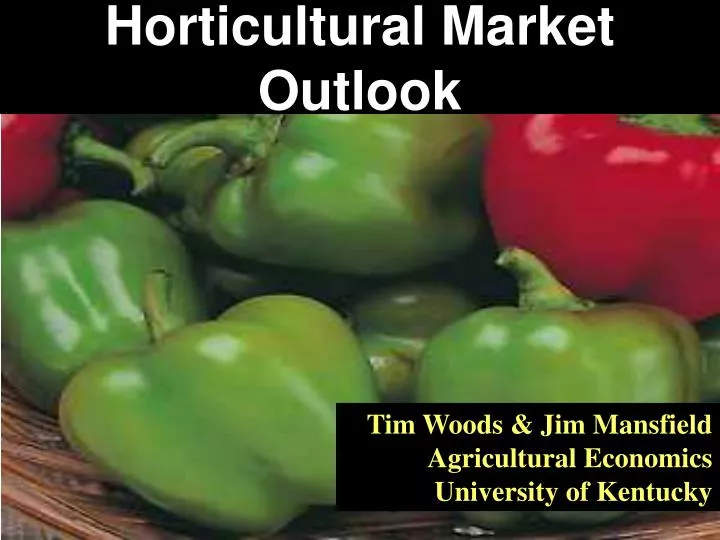
Fruits and Vegetables. Horticultural Market Outlook. Tim Woods & Jim Mansfield Agricultural Economics University of Kentucky. Source: USDA - Kentucky Agriculture Statistics Service. Source: USDA – Kentucky Agriculture Statistics Service. 2002 Nursery Stock Acres (thousand). 21. 8. 26. 1.

E N D
Fruits and Vegetables Horticultural Market Outlook Tim Woods & Jim Mansfield Agricultural Economics University of Kentucky
2002 Nursery Stock Acres(thousand) 21 8 26 1 4 5 11 38 18 1 6 1 7 8 4 36 • < 10,000 Acres • 10,000 – 30,000 acres > 30,000 acres Source: USDA 2002 Census of Agriculture
2002 Floriculture Production in Sq Ft(million) 13 14 33 2 6 7 10 11 25 2 5 2 11 9 4 320 • < 10 Million Sq Ft • 10 – 30 Million Sq Ft > 30 Million Sq Ft Source: USDA 2002 Census of Agriculture
Green Industry • Nationwide, total grower receipts for bedding plants have doubled in last decade • KY nursery/greenhouse growers - $79 million cash receipts in 2005 • Floriculture Industry leads in sales & growth, up $3 million to $43 total Sources: USDA/ERS Floriculture and Nursery Crops Situation and Outlook Yearbook, June 2005 & Sep. 2005 USDA/Kentucky Agriculture Statistics Service Agricultural Economics
Value of KY Wholesale Greenhouse & Nursery Sales, 1993-2005 Source: USDA/ERS Floriculture and Nursery Crops Situation and Outlook Yearbook, May 2004. Includes Christmas trees, vegetable plants.. Agricultural Economics
2002 Produce Acres(thousand) 79 60 44 11 49 12 51 43 86 29 55 28 48 300 21 1,122 • < 30,000 Acres • < 100,000 acres > 100,000 acres Source: USDA 2002 Census of Agriculture
2002 Produce Acreage (thousand acres) 0 0 543 230 35 281 2 6 238 33 275 6 2 246 12 36 5 101 14 60 44 79 2 0 83 13 45 11 50 10 37 12 51 4,105 40 43 86 106 197 29 76 55 48 28 300 351 21 50,000 to 100,000 acres 100,00 to 499,000 acres > 500,000 acres 1,122 Source: USDA Census of Agriculture 2002
1992-2002 Produce Acreage Changes (thousand acres) 0 0 +105 -9 -4 -92 +1 -1 -25 -28 -50 -1 0 -13 -5 -2 +2 0 -2 -11 0 -30 +2 -12 +3 -7 -9 -6 -5 +17 0 -9 -5 0 +823 +5 +5 +34 +11 0 -7 -24 -11 -2 +45 -57 -2 1 to +10,000 acres gain 11,00 to 45,000 acres gain > 100,000 acres gain -69 Source: USDA Census of Agriculture 1992 – 2002
2002 Value of Farm Direct Marketing(million dollars) 18 14 37 4 14 10 16 11 17 5 8 7 8 9 4 12 • < 10 Million Dollars • 10 – 30 Million Dollars > 30 Million Dollars Source: USDA 2002 Census of Agriculture
Kentucky Produce Marketing Channels Percent selling at least 10% of their produce into given market channel Source: Ernst & Woods, 2001-05 KY Produce Marketing Practices Surveys Direct markets include on-farm and off-farm retail, direct to restaurant/grocer, and CSA
Fruits and Vegetables: Kentucky Gross Farm Sales, 2006 • 2006 Produce Sales Estimate: $28 million • 107 community farmers markets: $6.5 million, 1800+ vendors • 78 Farm Bureau CRMs @ $120,000: Another $9 million • 4 produce auctions Another $2 million • 2 Co-ops Another $500,000 • Niche processed products (berries, grapes, HB 391), wholesale not through co-ops (grower-shipper), other direct sales (restaurants, CSA, etc): Another $8-10 million Source: NASS Ag Census, USDA_KY Ag Statistics Service Agricultural Economics
Percent Change in U.S. Per Capita Use of Selected Fresh Produce Crops, 1994-2004 *Others include: eggplant, garlic, squash, spinach, okra, pumpkins, greens, and others Source: July 2005 USDA/ERS Vegetables and Melons Situation and Outlook Yearbook (Table 1) Agricultural Economics
Fresh Market Romaine Lettuce? • 110% increase in per capita consump. 94-2004 • California Company inquires about KY sources • 95% of US Romaine is grown in CA & AZ • Freight costs from W. Coast are significant • Possible contracts with salad processors? • NC growers contract romaine for a Dole Co. Salad plant @ $.25 / lb Agricultural Economics
Fresh Market Romaine Lettuce? • NC & NJ breakeven cost est. = $6.15 – $7.00/ crt • NC yields 30,000 lbs/ac@ $.25 lb ($9.50/crt) • $7,500 gross - $5,000 cost = $2,500 return to land, management & machinery • 5 yrs of CA F.O.B. prices rarely below $5.00 • Freight +$4.50 in Aug & Sept 2006 Agricultural Economics
Fresh Market Romaine Lettuce? • Production on 2-row irrigated beds, 26,200 plnts • Specialized equipment needed: • Stainless steel 3 pt harvest conveyor $72,000 + • Accurate transplanter (mechanical 500 model) • Vacuum cooler……Big bucks!...lease? Agricultural Economics
Organic Produce? • Broader interest in organic food • 20% annual growth for last 10 years ($14 B 2005) • Organic food sales channels: • 47 % Conventional Supermarkets • 44% Natural Food Stores • 9% Direct Marketed • Fresh produce accounts for 42% of all organic food sales • 1/3 of organic produce sold under contract • Trend towards larger growers & direct to retailer sales Sources: Dimitri & Greene, 2002; USDA ERS-Oberholtzer, Dimitri & Greene, 2005; Organic Trade Asoc., 2004; Tondel & Woods, 2006 S Agricultural Economics
Organic Produce? Agricultural Economics
2006 KY Fruit Season • Good demand and prices for small fruit • 500+ commercial berry acres • Blueberry acres planted, double to 120 ac • Apple acreage reduced to less than 1,000 ac • Peach acreage up 20% to 600 acres • More wine grape acres reach full-bearing potential: 410 acres
1993 Wineries - 558 Alaska 26 1 2 1 1 6 35 6 6 31 2 16 2 7 5 7 4 10 1 6 6 336 7 3 2 5 2 2 1 3 13 Hawaii -- 1 50+ 3 20-49 10-19 1-9 Source: US Census Bureau, County Business Patterns
2004 Wineries – 1,413 Alaska -1 1 109 5 12 12 2 16 87 3 22 1 85 2 5 6 33 4 25 18 21 6 19 1 27 2 5 28 9 749 5 5 12 15 5 6 13 5 2 2 1 4 3 29 Hawaii -- 3 50+ 14 20-49 10-19 1-9 Source: US Census Bureau, County Business Patterns
Range of Grape Prices Paid By Regional Wineries, 2005$/ton 86 wineries surveyed Estimated KY Breakeven Price Per Ton: $650-1050 Source: Ernst & Woods, 2005 Regional Wine Grape Price Survey