Download
1 / 31
310 likes | 398 Views
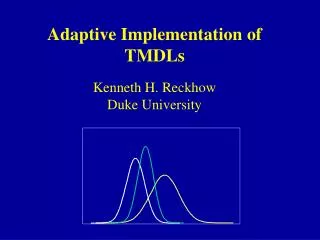
Water Quality in Catchments and its Impact on Human and Ecological Health Kenneth H. Reckhow Duke University. Primary Theme: Improvements in basic scientific understanding and advances in predictive modeling are essential for effective water quality management. Secondary Theme:

E N D
Water Quality in Catchments and its Impact on Human and Ecological Health Kenneth H. Reckhow Duke University
Primary Theme: Improvements in basic scientific understanding and advances in predictive modeling are essential for effective water quality management. Secondary Theme: There exist a number of useful practical strategies in the areas of technology, economics, government institutions, and stakeholder involvement.
ISSUES • Scientific understanding • Abatement technologies • Economic approaches • Political institutions • Predictive modeling Approach - use a case study to illustrate issues
Facts About the Neuse River • 3rd Largest River Basin in NC (16,000 Km2) • 320 kilometers long, 5000 stream kilometers • Estuary in lower 80 kilometers • 1.5 million people in basin, mostly near headwaters
Low DO and Fish Kills: 94-96 Cherry Point Streets Ferry
TMDLs – The US Approach for Basinwide Water Quality Management Total Maximum Daily Load (TMDL) For water bodies that do not meet water quality standards, states will be required to develop a management plan and determine the allowable pollutant loading (the TMDL) necessary to achieve compliance with the standard.
Application of Water Quality Standards North Carolina Dissolved Oxygen Standard - “not less than average of 5.0 mg/l with a minimum instantaneous value of not less than 4.0 mg/l” How can this standard be effectively implemented when natural water quality is variable and predictions are uncertain?
5 mg/l Probabilistic Water Quality Standards Actual Violations - based on a specified fraction of samples exceeding the numeric limit (5 mg/l) Predicted Violations - based on specified fraction ofthe posterior density function exceeding the numeric limit
As an alternative, we are developing a probability (Bayes) networkmodel using a set of simple mechanistic expressions that are identifiable using available data. As necessary, this model is being extended to incorporate judgmental probability assessment for narrative endpoints characterizing consequences of particular concern to stakeholders (e.g., harmful algal blooms and Pfiesteria).
Summer Total Summer Total Spring Total Phosphorus Load Nitrogen Load Nitrogen Load Summer Water Spring Summer Presence Average Productivity Clarity Productivity of Active Chl a Level Pfiesteria Existing Benthic Water Column # of Days of # of Severe Benthic O2 Demand 02 Demand Continuous Organic Algal Blooms Stratification Matter Days Between Bottom DO Avg. Days to Mixing Events Upon Mixing Deplete DO Human Health Impacts Freq. of Trapping Wind Anoxic Days in Season Reduction # of Major in Shellfish Fishkills Habitat
Nutrient Load Water Temperature Algal Growth Frequency of Mixing Events Water Temperature Sediment Oxygen Demand Frequency of Mixing Events Frequency of Hypoxia Sediment Oxygen Demand Fish Health Frequency of Hypoxia Example: A probability networkfor a subset of the relationships --
Cu Rv C Rd
8 Years of bi-weekly measurements at multiple mid-channel locations • Oxygen Concentration • Water Temperature • Salinity • Nonlinear regression parameter estimation R2=0.79 RSE=1.49 mg/l
mean = 23.8 days mean = 46.8 days s = 4.2 days s = 4.7 days Probability PredictedNumber of Summer Days DO < 4 mg/l DO < 2 mg/l Days Days
Nutrient Load Nutrient Recycling Algal Growth Human Health Water Clarity Pfiesteria Presence Water Temperature Frequency of Mixing Events Sediment Oxygen Demand Fish Health Frequency of Hypoxia
Some Useful Practical Lessons: • Low cost technologies (stream buffers) • Economic strategies (pollutant trading) • Political institutions (watershed associations) • Citizen involvement • Scientific Needs: • Improved process understanding at the basin scale • Better approaches to uncertainty in predictive modeling and WQ standards