Download
1 / 25
250 likes | 464 Views
Transparency International Corruption Perception Index 20 08 Transparency International-Estonia. Corruption Perception Index(CPI). Transparency International (international anti-corruption organisation) has been analysing the corruption perception since 1995.

E N D
Transparency International Corruption Perception Index 2008 Transparency International-Estonia
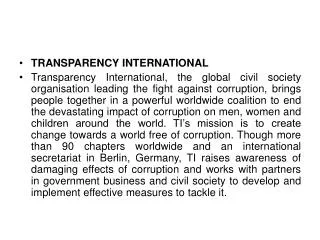
Corruption Perception Index(CPI) • Transparency International (international anti-corruption organisation) has been analysing the corruption perception since 1995. • In Estonia corruption perception has been analysed since 1998. • Today, on the 23rd of September CPI of 2008 is launched globally and simultaneously by local chapters of Transparency International.
Corruption Perception Index(CPI) • Estonia’s index improved by 0.1 grade and position by one rank. • 2008 – score 6,6, 27th position • In comparison: 2007 – score 6,5, 28th position • 2008 – 180 countries • 2007 – 180 countries
What is CPI 2008? • Measures the degree to which corruption is perceived to exist among public officials and politicians. • Draws on 13 different polls and surveys from 11 independent institutions carried out among experienced observers, such as business people and country analysts, including local experts.
Objectives • Measure the level of corruption in public sector by experienced observers, researchers (business people, academic persons, risk analysts). • To enhance comparative understanding of levels of corruption. • To offer a snapshot of the views of experts who influence trade and investment. • To stimulate scientific research and complementary diagnostic analysis on causes and consequences of corruption, both at international and national level. • To create public awareness of corruption – and create a climate for change.
Methodology • CPI is regularly conducted survey of surveys • Broad definition of corruption – use of public power for private benefits. • Minimum of 3 surveys per country • CPI 2008 consists of 2 previous years (-2005 3 years) • Country scores on a scale from 10 (very clean) to 0 (very corrupt). • A composite index - different sampling and varying methodologies.
What is taken into account? • Focused on perception not hard data(difficult to access and questionable value – is it possible to compare condemnatory judgements, cases, publications etc.). • Is considered: • Bribery of civil servants; • Drawbacks or hinders in public procurement ; • Embezzlement of public appliances; • Existence of anti-corruption policies and strategies and studies concerning their functioning; Includes as well as administrative and political corruption.
Year to year comparison • CPI gives a hint for the business people and different analysts, not so much focusing on the time-series trends. • Score matters more than rank.
Sources 2008 All the sources estimate the level of corruption in public sector • ADB: Country Performance Assessment Ratings by the ADB • AFDB: Country Policy and Institutional Assessment by the AFDB • BTI: Bertelsmann Transformation Index (Estonia 2007) • CPIA: Country Policy and Institutional Assessment by the IDA and IBRD • EIU: Economist Intelligence Unit (Estonia 2008) • FH: Freedom House, Nations in Transit (Estonia 2008) • GI: Global Insights (formerly World Markets Research Centre) (Estonia 2008) • IMD: World Competitiveness Report of the Institute for Management Development (Estonia 2007, 2008) • MIG: Merchant International Group (Estonia 2007) • PERC: Political and Economic Risk Consultancy, Hong Kong • WEF: Global Competitiveness Report of the World Economic Forum (Estonia 2007)
CPI challenges • Composite methodology can result in misinterpretation - Only the countries with sufficient information are analysed - Endeavours of the countries to fight corruption is not measured -inclusion of information of 2-3 years instead of one • Political sensitivity of CPI - Accusation that fingers are pointed at developing countries. - Ignores the actions taken in the countries to fight corruption
What is CPI good for? • promote public debates • Provide an incentive to conduct complementary local diagnostics • Create worldwide media coverage (raise awareness and draw attention) • Drive demand for change, as a powerful advocacy tool • Brand-identify TI globally
CPI 2008 Ranking Countries perceived as being least corrupt Follow: Finland, Switserland, Iceland, Nederlands, Australia, Canada, Luxembourg, Austria, Hong Kong, Germany, Norway, Ireland, United Kingdom, Belgium, Japan, USA, Saint Lucia, Barbados, Chile, France, Uruguay, Slovenia, Estonia
Rank Country Index 1. Denmark 9,3 1. Sweden 9,3 4. Finland 9,0 7. Nederlands 8,9 11. Luxembourg 8,3 12. Austria 8,1 14. Germany 8,1 16. Ireland 7,7 16. United Kingdom 7,7 18. Belgium 7,3 23. France 6,9 26. Slovenia 6,7 27. Estonia 6,6 28. Spain 6,5 31. Cyprus 6,4 32. Portugal 6,1 36. Malta 5,8 45. Czech Republic 5,2 47. Hungary 5,1 52. Slovakia 5,0 52. Latvia 5,0 55. Italy 4,8 57. Greece 4,7 58. Lithuania 4,6 58. Poland 4,6 70. Rumenia 3,8 72. Bulgaria 3,6
CPI 2008 Ranking Countries perceived as being most corrupt
Interesting: Ranking Country Index • 109 (117) Moldova 2,9 (2,8) • 67 (79) Georgia 3,9 (3,4) • 134 (118) Ukraine 2,5 (2.7) • 147 (143 ) Russia 2,1 (2,3) • 151 (150) Belorussia 2,0 (2.1)
Estonia in CPI tabel 1998 - 2007 Year Countries Ranking Index Sources 1998 85 26 5,7 3 1999 99 27 5,7 7 2000 90 27 5,7 4 2001 91 28 5,6 5 2002 102 29-30 5,6 8 2003 133 33-34 5,4 12 2004 146 31-33 6,0 12 2005 158 27 6,4 11 2006 163 24-25 6,7 8 (2a) 2007 180 28 6,5 8 (2a) 2008 180 27 6.6 8 (2a)
Possible influence on Estonia’s CPI Positive: • Adoption of new anti-corruption strategy for the years 2008-2012 • Active investigation of corruption by law machinery • Raise in general corruption awareness Negative: • Disclosure of new corruption impeachments • Insufficient control over local governments and public procurement • Insufficient supervision over party financing
Info: www.transparency.ee, Ph 6 844 074 Contact: info@transparency.ee