Download
1 / 10
100 likes | 122 Views
Learn how firms in perfect competition maximize profit in the short run using revenue-cost approaches. Understand loss minimization and shutdown points.

E N D
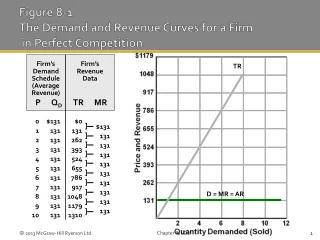
Firm’s Demand Schedule (Average Revenue) Firm’s Revenue Data ] ] ] ] ] ] ] ] ] ] Figure 8-1 The Demand and Revenue Curves for a Firm in Perfect Competition TR P QD TR MR 0 1 2 3 4 5 6 7 8 9 10 $131 131 131 131 131 131 131 131 131 131 131 $0 131 262 393 524 655 786 917 1048 1179 1310 $131 131 131 131 131 131 131 131 131 131 D = MR = AR Chapter 8, LO2 LO3
8.3 Profit Maximization in the Short Run • Perfectly competitive firm can maximize its profit (minimize its loss) only by adjusting output • Two Approaches: • Total revenue-total cost approach • Marginal revenue-marginal cost approach Chapter 8, LO3
Total-Revenue - Total-Cost Approach to Profit Maximization for a Firm in a Perfectly Competitive Industry (Price = $131) Chapter 8, LO3
Figure 8-2Total-Revenue - Total-Cost Approach to Profit Maximization for a Firm in a Perfectly Competitive Industry (Price = $131) $1800 1700 1600 1500 1400 1300 1200 1100 1000 900 800 700 600 500 400 300 200 100 Total Revenue and Total Cost 0 0 1 1 2 2 3 3 4 4 5 5 6 6 7 7 8 8 9 9 10 10 11 11 12 12 13 13 14 14 Quantity Demanded (Sold) $500 400 300 200 100 Total Economic Profit Quantity Demanded (Sold) Break-Even Point (Normal Profit) Total Revenue, (TR) Maximum Economic Profit $299 Total Cost, (TC) P=$131 Break-Even Point (Normal Profit) Total Economic Profit $299 Chapter 8, LO3
Short-Run Profit-Maximizing for a Firm in aPerfectly Competitive Industry Chapter 8, LO3
$200 150 100 50 0 1 2 3 4 5 6 7 8 9 10 Figure 8-3Short-Run Profit-Maximizing for a Firm in a Perfectly Competitive Industry MR = MC MC P=$131 Economic Profit MR = P ATC Cost and Revenue AVC A=$97.78 Output Chapter 8, LO3
Loss-Minimizing Case • Loss minimization • Still produce because P > minAVC • Losses at a minimum where MR=MC Chapter 8, LO3
Short-Run Profit-Maximizing for a Firm in aPerfectly Competitive Industry Chapter 8, LO3
$200 150 Cost and Revenue 100 50 0 1 2 3 4 5 6 7 8 9 10 Output Figure 8-4The Short-Run Loss-Minimizing Position of a Firm in a Perfectly Competitive Industry MC Loss A=$91.67 ATC AVC P=$81 MR = P V = $75 Chapter 8, LO3
$200 150 Cost and Revenue 100 50 0 1 2 3 4 5 6 7 8 9 10 Output Figure 8-5 The Short-Run Shutdown Position of a Firm in Perfect Competition MC ATC V = $74 AVC MR = P P=$71 Short-Run Shut Down Point P < Minimum AVC $71 < $74 Chapter 8, LO3 8-10