Download
1 / 47
470 likes | 616 Views
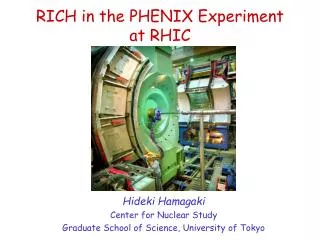
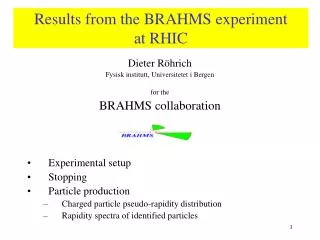
Results on Particle Yields from the PHENIX Experiment at RHIC. Tatsuya Chujo (BNL) for the PHENIX Collaboration. r, w, f etc. jet. p. K. p. m. Time. g. e. Space (z). Au. Au. Space-time Evolution of System at RHIC. Hadronization (Freeze-out) + Expansion.

E N D
Results on Particle Yields from the PHENIX Experiment at RHIC Tatsuya Chujo (BNL) for the PHENIX Collaboration
r, w, f etc.. jet p K p m Time g e Space (z) Au Au Space-time Evolution of System at RHIC Hadronization (Freeze-out) + Expansion Mixed phase QGP phase Thermalization Pre-equilibrium Hadrons reflectthe bulk property of created system and its evolution!
Characterize freeze-out • Hydrodynamic Collective Expansion • Identified charged hadron spectra vs. centrality • <pT> vs. centrality • Hydro-dynamical model fit. • Elliptic flow (identified particle) vs. hydro. model • Space-time evolution of the System • Pion HBT correlation (kT and centrality dependence) • Deuteron / anti-deuteron spectra and coalescence model • Chemical Composition • Particle ratios for same mass • p/ p ratio vs. pT and centrality • dN/dy for p, K, p and anti-proton vs. centrality • L, Lbar yield We present the first results of identified charged hadrons in Au+Au @ sqrt(sNN) = 200 GeV at mid-rapidity from the PHENIX experiment.
15-20% 10-15% 5-10% 0-5% 0-5% Event Selection • Centrality selection : Used charge sum of Beam-Beam Counter (BBC, |h|=3~4) and energy of Zero-degree calorimeter (ZDC) in minimum bias events. • Extracted Npart based on Glauber model.
Charged Particle Identification at PHENIX • Single particle spectra and • elliptic flow w.r.t reaction • plane analysis • PID by high resolution TOF • broad pT range • p, K < 2 GeV • proton, anti-proton < 4 GeV • Df = p/4 • HBT analysis • Time-of-Flight • by Calorimeter • large acceptance • (Df = p)
Single Particle Spectra at most central events (0-5 %) PHENIX Preliminary PHENIX Preliminary Au+Au at sqrt(sNN) =200GeV Au+Au at sqrt(sNN) =200GeV • proton yield ~ pion yield @ 2 GeV
centrality 0 - 5 % 5 - 10 % 10 - 15 % 15 - 20 % 20 - 30 % 30 - 40 % 40 - 50 % 50 - 60 % 60 - 70 % 70 - 80 % 80 - 91 % Pion pT spectra (centrality dependence) p+ p- PHENIX Preliminary PHENIX Preliminary Characterized by power law shape for all centralities
centrality 0 - 5 % 5 - 10 % 10 - 15 % 15 - 20 % 20 - 30 % 30 - 40 % 40 - 50 % 50 - 60 % 60 - 70 % 70 - 80 % 80 - 91 % Kaon pT spectra K+ K- PHENIX Preliminary PHENIX Preliminary Characterized by mT exponential shape for all centralities
centrality 0 - 5 % 5 - 10 % 10 - 15 % 15 - 20 % 20 - 30 % 30 - 40 % 40 - 50 % 50 - 60 % 60 - 70 % 70 - 80 % 80 - 91 % p p, pbar pT spectra p PHENIX Preliminary PHENIX Preliminary Characterized by Boltzmann function shape for all centralities
<pT> vs. Npart <pT> [GeV/c] <pT> [GeV/c] • Systematic error on • 200 GeV data • p (10 %), K (15 %), • p (14 %) open symbol : 130 GeV data • Increase of <pT> as a function of Npart and tends to saturate • p < K < proton (pbar) • Consistent with hydrodynamic expansion picture.
Au+Au at sqrt(sNN) =200GeV Hydrodynamic Model Fit to the Spectra See talk of J.M. Burward-Hoy Most central collisions for 200 GeV data Freeze-out Temperature Tfo = 110 23 MeV Transverse flow velocity bT = 0.7 0.2 Ref: E. Schnedermann, J. Sollfrank, and U. Heinz, Phys. Rev. C 48, 2462 (1993) • bT increases from peripheral to mid-central (Npart < 150) and • tends to saturate for central collisions.
The elliptic flow (azimuthal asymmetries) provides information on pressure at very early stage of the collisions.
Elliptic Flow Measurements w.r.t reaction Target Projectile Au Reaction plane determination By Beam-beam counter (|h|=3~4) Less non-flowcontributions. Au Reaction plane b : Impact parameter
v2 of Identified Hadrons See talk of S. Esumi Au+Au at sqrt(sNN) =200GeV, Minimum bias, Reaction Plane | h |=3~4 v2 v2 hydro model including the1st order phase transition with Tf=120MeV (*) pion proton * P. Huovinen et al. Phys. Lett. B503 (2001) 58 Negatives p-&K-, pbar Positives p+& K+, p PHENIX Preliminary PHENIX Preliminary PHENIX Preliminary PHENIX Preliminary pT (GeV/c) pT (GeV/c) • Good agreement with hydrodynamic model calculation up to 1.5 GeV. • Deviation for pions from model at higher pT?
Another experimental constraint on expansion: HBT vs. momentum Bertsch-Pratt parameterization
kT dependence of R Centrality is in top 30% • Broad <kT> range : 0.2 - 1.2 GeV/c • All R parameters decrease as a function of kT • consistent with collective expansion picture. • Stronger kT dependent in Rlong have been observed. kT : average momentum of pair
R vs. Npart1/3 Au+Au at sqrt(sNN) =200GeV Fit with p0+p1*Npart^1/3 Rout weaker increase with Npart
Rout/ Rside vs. kT and Npart • No dependence of Rout/Rside as a function of <kT> and Npart • Large kT range is strong challenge for dynamical models. See talk of A. Enokizono (3D pp, KK) and poster of M. Heffner (1D KK, pp)
Deuteron Coalescence from proton and neutron provides another measure of space-time evolution to be compared to HBT.
Deuteron Identification by TOF Au+Au at sqrt(sNN) =200GeV • Clear deuteron and anti-deuteron signals have been observed • in 200 GeV data, using 23 M minimum bias events.
Deuteron and anti-deuteron spectrum Au+Au at sqrt(sNN) =200GeV • PID by TOF detector. • Fitted by mT exponential function.
Coalescence model for anti-deuteron See poster of A.K. Purwar and R. Rietz 1/B2QV Au+Au at sqrt(sNN) =200GeV • Weak beam energy dependence from SPS to RHIC. • Similar behavior has been observed in pion HBT correlations.
Chemical composition at freeze-out can be deduced from particle ratios.
p-/ p+ ratio vs. pT Central Peripheral Au+Au at sqrt(sNN) =200GeV Au+Au at sqrt(sNN) =200GeV p-p data (200 GeV) • Flat pT dependence • No centrality dependence
K-/K+ Central Peripheral Au+Au at sqrt(sNN) =200GeV Au+Au at sqrt(sNN) =200GeV p-p data (200 GeV) • Flat pT dependence • No centrality dependence
pbar/p Central Peripheral Au+Au at sqrt(sNN) =200GeV Au+Au at sqrt(sNN) =200GeV • Flat pT dependence for central. • Decreasing for peripheral > 3 GeV? See talk of T. Sakaguchi (Au-Au) and poster of S. Sato (p-p data)
Estimate of Baryon Potential Statistical thermal model hep-ph/0002267 F.Becattini et al. PHENIX preliminary (200 GeV), central (0-10%) • p- / p+ = 1.02 0.02 (stat) 0.1 (sys) • K- / K+ = 0.92 0.03 (stat) 0.1(sys) • pbar / p = 0.70 0.04 (stat) 0.1(sys) Baryon chemical potential mB~ 30MeV
p /p See talk of T. Sakaguchi p /p Central Peripheral • proton yield is comparable with pions @ 2 GeV in central collisions, less in peripheral.
dN/dy PHENIX Preliminary PHENIX Preliminary Au+Au at sqrt(sNN) =200GeV Au+Au at sqrt(sNN) =200GeV p+ p+ dN/dy / (0.5 Npart) K+ K- p open symbol : 130 GeV data pbar Positive Negative Npart Npart • Similar centrality dependence 130 GeV and 200 GeV
nucl-ex/0204007 5% Most Central Minimum bias L’s via combinatorial method Au+Au at sqrt(sNN) =130GeV nucl-ex/0204007 Invariant mass distribution Well described by Boltzmann function (0.4 < pT < 1.8 GeV/c) for central 0-5% and minimum bias spectra.
½ x Feed-down corrected p, pbar spectra See poster of T. Arkadij • Ratios (130 GeV data) nucl-ex/0204007 L/p = 0.89 0.07(stat) (anti-L)/(anti-proton) = 0.95 0.09(stat) (anti-L)/L = 0.75 0.09(stat) Au+Au at sqrt(sNN) =130GeV nucl-ex/0204007 • Reasonable agreement in net L and proton yield by HIJING/B model • (non perturbative gluon junction mechanism)
Summary (I) We presented the first results of identified charged particle spectra and yields (p, K, p, pbar, d, dbar), azimuthal correlation w.r.t reaction plane for identified hadrons, HBT correlations at sqrt(sNN) = 200 GeV and the L results from 130 GeV data. • Hydrodynamic Collective Expansion • All results of 200 GeV data indicate a strong collective expansion at central collisions. • <pT> vs. centrality : the heavier mass, the larger <pT>, steep rise at peripheral to mid-central collisions. • Hydro-dynamical model fit to the spectra bT = 0.7, Tfo = 110 MeV • Elliptic flow (identified particle) vs. hydro. Model Good agreement with hydro model < 1.5 GeV, deviated from hydro > 2GeV for pions.
Summary (II) • Space-time evolution of the System • R values are very similar to sqrt(sNN) = 130 GeV. • Much large kT range for HBT in 200 GeV data. • No dependence of Rout/Rside on <kT>, Npart. • Deuteron, anti-deuteron B2 show weak energy dependence from SPS to RHIC, similar to HBT results. • Chemical Composition • Baryon chemical potential ~ 30 MeV. • No pT and centrality dependence for p- /p+, K-/K+, pbar/p ratio. • proton yield is comparable with pions @ 2 GeV in central collisions, less in peripheral. • Feed down corrected p, pbar spectra for 200 GeV data can be done soon.
dNch /dy comparison Backup Slide
130 GeV vs. 200 GeV (MB) Backup Slide
PHENIX Preliminary PHENIX Preliminary Single Particle Spectra at most peripheral events (80-91 %) Au+Au at sqrt(sNN) =200GeV Au+Au at sqrt(sNN) =200GeV Backup Slide
Comparison between 130 GeV and 200 GeV • Less protons in 200 GeV data than 130 GeV data Backup Slide
K/p Ratio vs. pT • K/p ratio above 1.5 GeV : (peripheral) < (mid-central) < (central) • reflected shape changes as a function centrality Backup Slide
qout qlong qside Two Particle Correlations (HBT) for pions • Full analytic coulomb corrections. • Taking account two track separations. • 50 M Minimum-bias data sample. Bertsch-Pratt parameterization Backup Slide
3D HBT Example for pions PHENIX Preliminary Au+Au at sqrt(sNN) =200GeV 50 M M.B. events 0.2<kT<2.0GeV/c, <kT>=0.46GeV/c Bertsch-Pratt parameterization Backup Slide
L Analysis (130 GeV data) PbSc • Used 1.3 M minimum bias events from 130 GeV data. • Hadron PID by EMC (PbSc) • West arm PbSc EMC-TOF (sTOF ~700 ps in Run1) for PID (2s cut) • Pion ID : pT < 0.6 GeV/c, proton ID : pT < 1.4 GeV/c • Used combinatorial method to extract lambda. Backup Slide
L/L ratio vs. pT and Npart • No pT and Npart dependences in • anti-L/L ratio • Averaged anti-L/L ratio : • 0.75 0.09 • No pT dependence • Consistent with the statistical • thermal model Backup Slide
PID plot for reaction plane v2 analysis Backup Slide
Hydro model --- pion --- kaon --- proton v2 of Identified Hadrons (p, K, p) Au+Au at sqrt(sNN) =200GeV, Minimum bias, Reaction Plane | h |=3~4 v2 v2 PHENIX Preliminary PHENIX Preliminary • Hydro model : P. Huovinen et al. • Phys. Lett. B503 (2001) 58 Negatives h-,pi-,K-,pbar Positives h+,pi+,K+,p PHENIX Preliminary PHENIX Preliminary pT (GeV/c) pT (GeV/c) Backup Slide