Download
1 / 27
340 likes | 1.2k Views
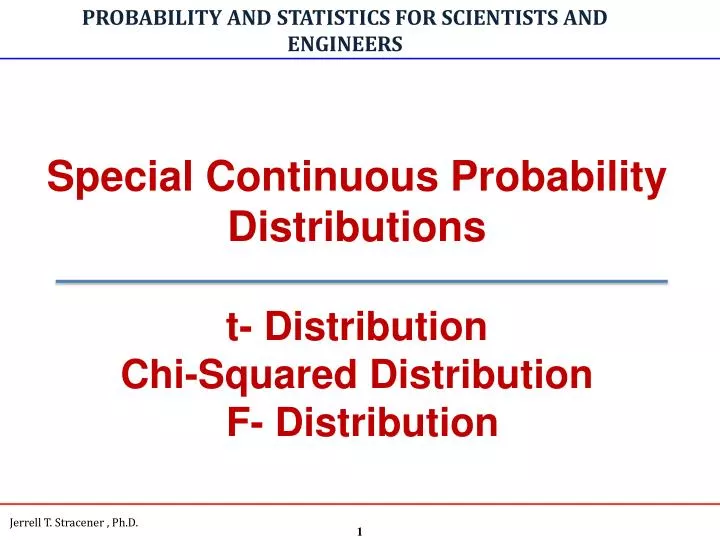
PROBABILITY AND STATISTICS FOR SCIENTISTS AND ENGINEERS. Special Continuous Probability Distributions t- Distribution Chi-Squared Distribution F- Distribution. t - DISTRIBUTION. t-Distribution – Probability Density Function.

E N D
PROBABILITY AND STATISTICS FOR SCIENTISTS AND ENGINEERS Special Continuous Probability Distributionst- DistributionChi-Squared Distribution F- Distribution
t-Distribution – Probability Density Function A random variable T is said to have the t-distribution with parameter , called degrees of freedom, if its probability density function is given by: , - < t < where is a positive integer
t-Distribution – Table of Probabilities Remark: The distribution of T is usually called the Student-t or the t-distribution. It is customary to let tp represent the t value above which we find an area equal to p. Values of T, tp,ν for which P(T > tp,ν) = p p tp t 0
-3 -2 -1 0 1 2 3 t-distribution - Probability Density Function for various values of
Table of t-Distribution t-table gives values of tp for various values of p and ν. The areas, p, are the column headings; the degrees of freedom, ν, are given in the left column, and the table entries are the t values.
t-Distribution - Example If T~t10, find: (a) P(0.542 < T < 2.359) (b) P(T < -1.812) (c) t′ for which P(T>t′) = 0.05 .
Example Solution P(0.542 < T < 2.359) = 0.3-0.02 =0.28 P(T < -1.812)=F(-1.812) =P(T > 1.812)=0.05 (c) t′ for which P(T>t′) = 1-F(t′ ) =0.05 . t′ = 1.812 t 0.542 0 2.359 t -1.812 1.812 0 0.05 t t′ 0
Chi-Squared Distribution – Probability Density Function A random variable X is said to have the Chi-Squared distribution with parameter ν, called degrees of freedom, if the probability density function of X is: , for x > 0 , elsewhere where ν is a positive integer.
Chi-Squared Distribution - Remarks The Chi-Squared distribution plays a vital role in statistical inference. It has considerable application in both methodology and theory. It is an important component of statistical hypothesis testing and estimation. The Chi-Squared distribution is a special case of the Gamma distribution, i.e., when = ν/2 and = 2.
Chi-Squared Distribution – Mean and Standard Deviation Mean or Expected Value Standard Deviation
f(x) p x Chi-Squared Distribution – Table of Probabilities It is customary to let 2prepresent the value above which we find an area of p. This is illustrated by the shaded region below. For tabulated values of the Chi-Squared distribution see the Chi-Squared table, which gives values of 2pfor various values of p and ν. The areas, p, are the column headings; the degrees of freedom, ν, are given in the left column, and the table entries are the 2values.
Chi-Squared Distribution – Example c 2 X 15 χ′
f(x) f(x) f(x) x x x Example Solution P(7.261 < X < 24.996) = 0.95-0.05 =0.9 (b)P(X<6.262)= 0.025 χ′ For which P(X < χ′) =0.02 χ′ = 5.985 24.996 7.261 6.262 P χ′
F-Distribution – Probability Density Function A random variable X is said to have the F-distribution with parameters ν1 and ν2, called degrees of freedom, if the probability density function is given by: , 0 < x < 0 , elsewhere Note : The probability density function of the F-distribution depends not only on the two parameters ν1 and ν2 but also on the order in which we state them.
F-Distribution - Application Remark: The F-distribution is used in two-sample situations to draw inferences about the population variances. It is applied to many other types of problems in which the sample variances are involved. In fact, the F-distribution is called the variance ratio distribution.
6 and 24 d.f. 6 and 10 d.f. x 0 F-Distribution – Probability Density Function Shapes Probability density functions for various values of ν1 and ν2 f(x)
F-Distribution – Table of Probabilities The fp is the f value above which we find an area equal to p, illustrated by the shaded area below. For tabulated values of the F-distribution see the F table, which gives values of xp for various values of ν1 and ν2. The degrees of freedom, ν1 and ν2 are the column and row headings; and the table entries are the x values. f(x) p x
F-Distribution - Properties Let x(ν1, ν2) denote x with ν1 and ν2 degrees of freedom, then
F-Distribution – Example If Y ~ F6,11, find: (a) P(Y < 3.09) (b) y′ for which P(Y > y′ ) = 0.01
Example Solution P(Y < 3.09) = F(3.09) = 1- P(Y > 3.09) = 1 - 0.05 =0.95 (b) P(Y > y′ ) = 0.01 y′ =5.07 f(y) y p 3.09 f(y) y 0.01 y′