Download
1 / 19
220 likes | 428 Views
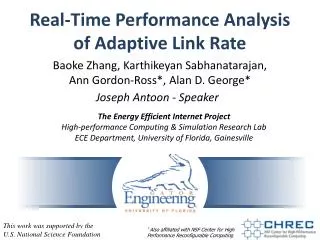
Real-Time Performance Analysis of Adaptive Link Rate. Joseph Antoon - Speaker. The Energy Efficient Internet Project High-performance Computing & Simulation Research Lab ECE Department, University of Florida, Gainesville.

E N D
Real-Time Performance Analysis of Adaptive Link Rate Joseph Antoon - Speaker The Energy Efficient Internet Project High-performance Computing & Simulation Research Lab ECE Department, University of Florida, Gainesville Baoke Zhang, Karthikeyan Sabhanatarajan, Ann Gordon-Ross*, Alan D. George* This work was supported by the U.S. National Science Foundation * Also affiliated with NSF Center for High Performance Reconfigurable Computing
Introduction INTERNET
Introduction • Connected edge devices account for 2% of the total power consumed in the US [EPA-06] • 130 TWh/Year • 1 single-unit nuclear power plant outputs 8 TWh/Year • Translates to 16 single-unit nuclear power plants!
Introduction 10Gbps +16W • Ethernet links • As they grow faster… • They eat more power! • But, this corresponds to data capacity, right? 1Gbps +4W 100Mbps
Introduction 10Gbps +16W • Wrong! • Average traffic has 5% utilization 1Gbps +4W Wasted! 100Mbps (Actually needed)
Adaptive Link Rate • Ethernet links rarely utilized • Only need high capacity for short bursts • Adaptive Link Rate • Use low link rate • During idle periods Time link utilization link waste
Adaptive Link Rate Network Interface Card Network Uh oh, need more throughput! 100M 1G Tx Buffer MAC PHY Rx Buffer
Drawbacks • Can’t send packets while switching • Long switching time interrupts connections • Result: Performance hit! Tx Buffer From PC To MAC
Drawbacks Link Rate Switch Energy Saved Energy Switching costs energy Goal: Positive net energy consumption Result: Minimum time to stay in low rate!
Goals Goals • How long to switch? • Previous work assumes 1-10ms • How much energy to switch • How long to stay in low rate? • Solution: Build a prototype • Virtex II Pro Development Kit • RiceNIC-based architecture
Determines when To change link rate Coordinates link rate change Generates synthetic traffic Modified RiceNIC Architecture MAC Core MIIM Control Policy CRC Addr Add PHY Interface PCI Interface MAC Control Unit FIFO Tx Control Flow Control Rx Control FIFO FIFO CRC
Experiment 100M 1G • MAC Handshake time • How long to coordinate switch • PHY Register Time • How long to trigger rate change • PHY Resynchronization time • How long to physically reset link MAC PHY
>700,000% Longer Results – Average Times
Not too bad! Results – Switching Power But what about energy?
Results – Energy 10M ↔ 1G costs so much when… • Why not just switch to 100M, then 10M? + <
Minimum Time in Low Link Rate 20.8 Assuming a switch time makes a big difference!
Conclusions • First hardware prototype of an Adaptive Link Rate (ALR) enabled NIC • Observed switching times much longer than previously assumed • “Step down” method uses less energy than switching from 1Gbps than 10Mbps
Thank you for attending! Any Questions?